
Figures & data
Figure 1. Heat wave-related mortalities around the globe during the past decades. Map generated using MapChart (Citation2022).
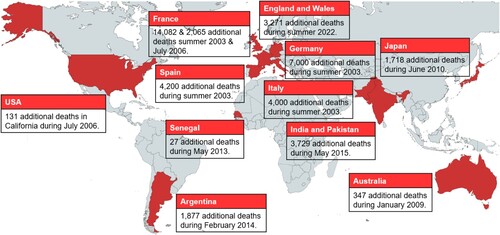
Table 1. Summary of recent literature on heatwave impacts on building performance.
Figure 2. Proposed study workflow.
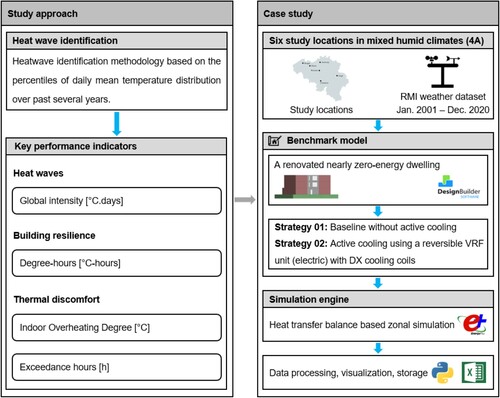
Figure 3. Heat wave detection thresholds (Ouzeau et al. Citation2016).
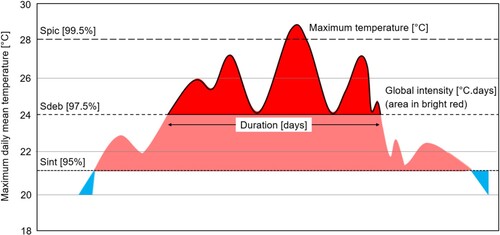
Figure 4. Belgian study locations and the weather stations used for data extraction used in the study.
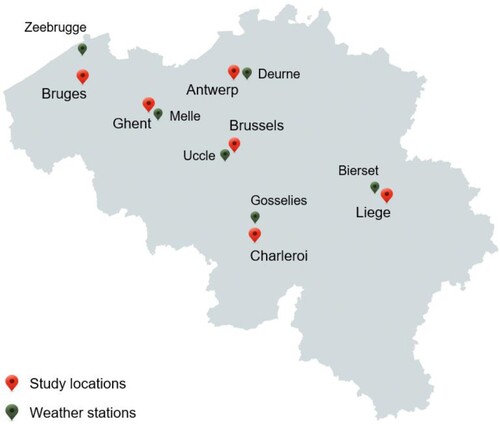
Figure 5. The renovated nearly zero-energy dwelling simulation model and floor layout.
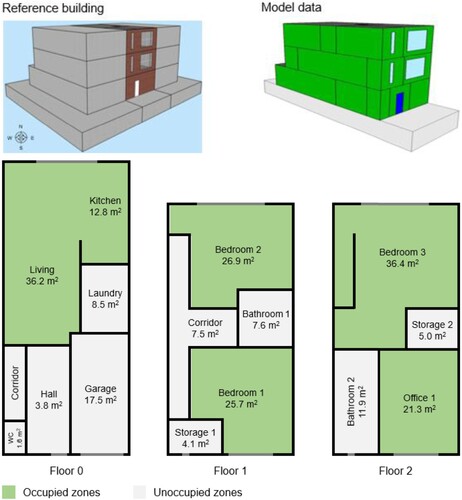
Figure 6. Heat waves identified and classified across the study locations in Belgium from 2001 to 2020.
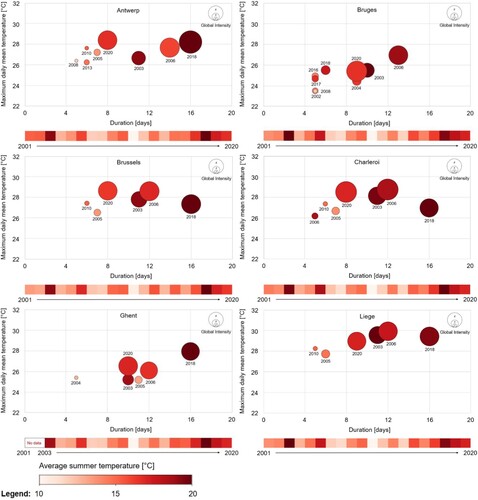
Figure 7. The most intense heat waves with occurrence [year], global intensity [°C.days], maximum temperature [°C], and duration [days] geolocated on the study locations in Belgium from 2001 to 2020.
![Figure 7. The most intense heat waves with occurrence [year], global intensity [°C.days], maximum temperature [°C], and duration [days] geolocated on the study locations in Belgium from 2001 to 2020.](/cms/asset/b4ef4f46-8322-4981-9c28-65d619fdc5a1/tbps_a_2253460_f0007_oc.jpg)
Figure 8. Characterization of thermal resilience of cooling strategies in reference dwelling before, during, and after the intense heat wave in Antwerp, Belgium, from July 16, 2018, to August 14, 2018.
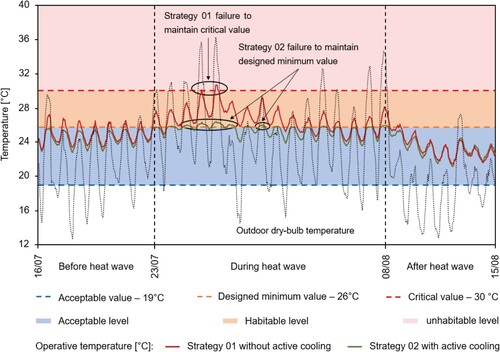
Table 2. Thermal resilience quantification using degree-hours [°C-hours] for cooling strategies outside each temperature threshold before, during, and after the intense heat wave in Antwerp, Belgium, from July 16, 2018, to August 14, 2018.
Figure 9. Indoor Overheating Degree [°C] in different occupied zones in the reference nearly zero-energy dwelling before, during, and after the most intense heat wave in Antwerp, Belgium, from July 16, 2018, to August 14, 2018.
![Figure 9. Indoor Overheating Degree [°C] in different occupied zones in the reference nearly zero-energy dwelling before, during, and after the most intense heat wave in Antwerp, Belgium, from July 16, 2018, to August 14, 2018.](/cms/asset/3114ea85-6091-4e49-b3cc-7cc978277378/tbps_a_2253460_f0009_oc.jpg)
Figure 10. Percentage of overheating exceedance hours [%] in the reference dwelling zones during the intense heat wave in Antwerp, Belgium, from July 23, 2018, to August 07, 2018.
![Figure 10. Percentage of overheating exceedance hours [%] in the reference dwelling zones during the intense heat wave in Antwerp, Belgium, from July 23, 2018, to August 07, 2018.](/cms/asset/02756eeb-f79a-4bc4-8bdc-9ea38de8c4e3/tbps_a_2253460_f0010_oc.jpg)
Table A.1. The general description of the reference dwelling.
Table A.2. The DesignBuilder model inputs.
Data availability statement
The Python code used for heatwave identification, classification, and visualization is available at: doi.org/10.5281/zenodo.7326894 (Joshi et al. Citation2022).