
Figures & data
Table 1. Data headers from Transport Scotland EV charging dataset.
Table 2. Data headers from the City of Glasgow EV charging dataset.
Figure 1. Probability and cumulative probability of weekly vehicle charging frequency, , derived from the transport Scotland dataset.
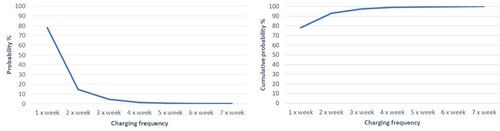
Table 3. Daily charging probability modifiers.
Figure 2. Probability distribution, and cumulative probability distributions,
of EV charging event starting for weekdays and weekends derived from the Transport Scotland dataset.
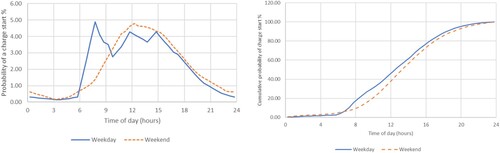
Figure 3. The probability and cumulative probability
and off a particular charge being taken (kWh).
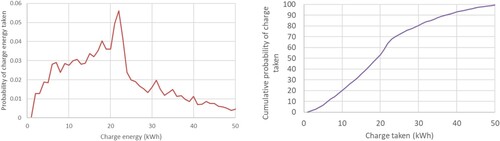
Figure 4. Flow chart illustrating a vehicle-centric probability-based algorithm to calculate an aggregate charging profile.
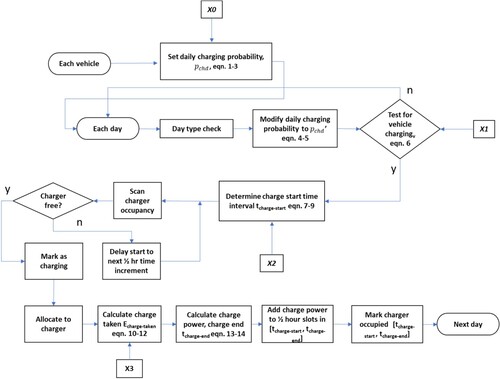
Figure 5. Example of demand profile for a fleet of 80 electric vehicles.
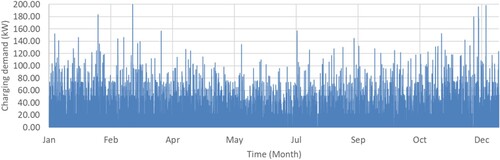
Figure 6. Simulated and monitored time-dependent charging probabilities.
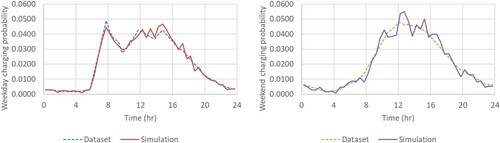
Figure 7. Simulated and monitored cumulative probabilities of charge taken during a charge event.
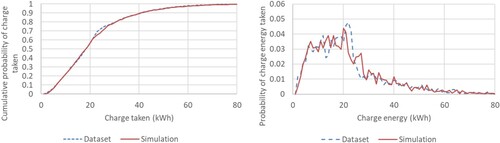
Figure 8. Mean charge taken and std. dev. of charge taken from dataset and simulation.
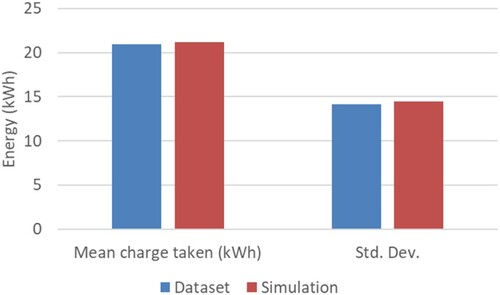
Figure 9. Duke St car park (Image: Google street view) and rendered image of the ESP-r Duke St Car Park model with roof-mounted PV arrays and shading from surrounding buildings.
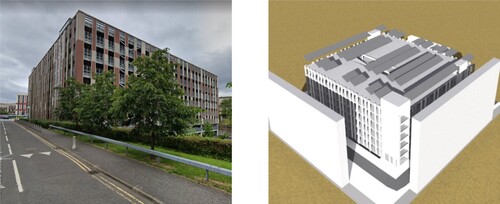
Table 4. Characteristics of the PV panels used in the analysis (Longi Citation2020).
Figure 10. PV array annual energy yield vs slope.
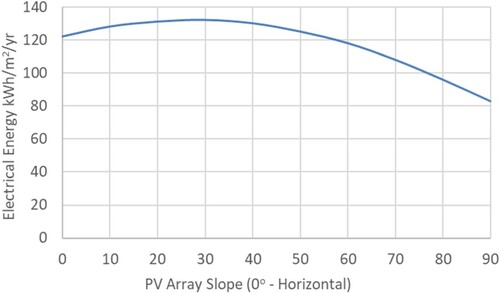
Figure 11. Simulated car park half-hourly PV output.
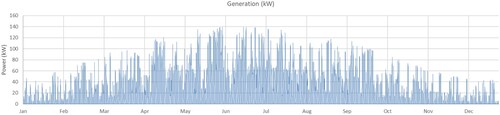
Figure 12. Car park charging hub electrical load flow model.
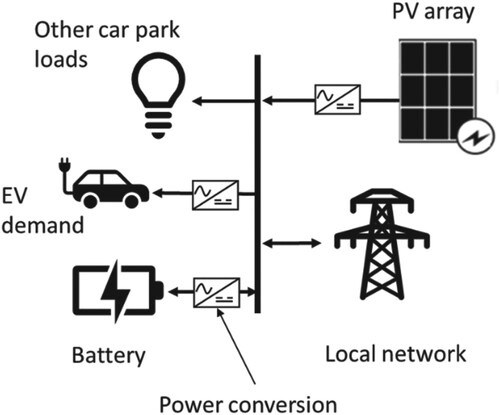
Table 5. Battery parameters used with the model (GCC Citation2018).
Table 6. Charger ‘fleet’ used with the model (ChargePlace Scotland Citation2023).
Figure 13. Example of time series output from the simulation, for the case with 50 vehicles and 100 kWh battery.
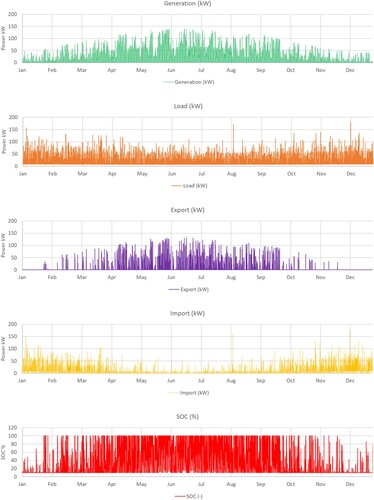
Table 7. Annual simulated electrical demand with different numbers of vehicles using the huba.
Figure 14. REC and RUF (expressed as a %) for different supporting battery sizes and vehicle fleets.
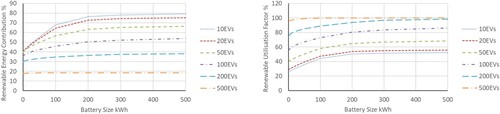
Figure 15. Imported electrical energy against battery size for different vehicle fleets.
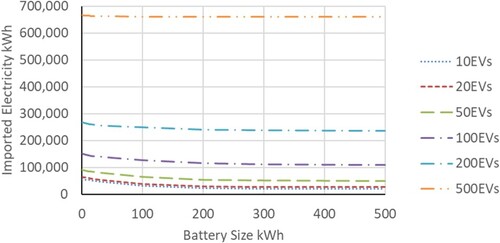
Figure 16. Peak imported power against battery size for different vehicle fleets.
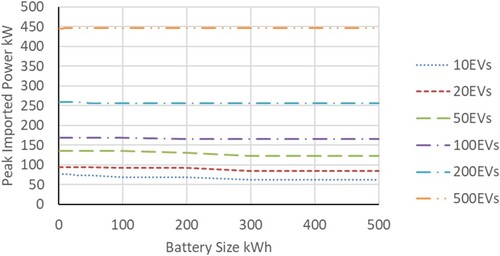
Figure 17. Exported electrical energy against battery size for different vehicle fleets.
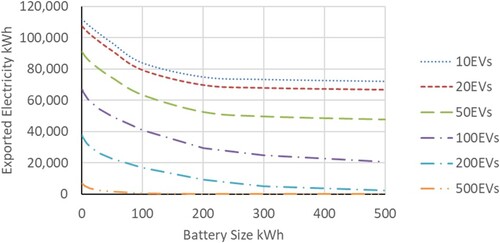
Figure 18. Peak exported electrical power against battery size for different vehicle fleets.
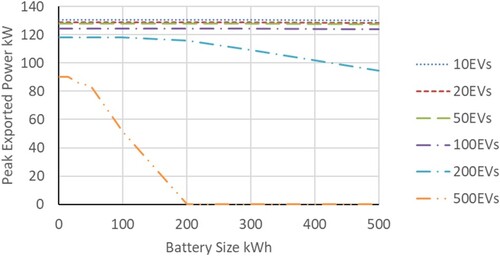
Figure 19. Simulated variation in PV output, vehicle demand, battery SOC, power export and import on 20/21 June for the case with 500 vehicles and 500 kWh battery.
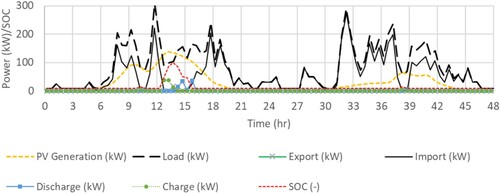
Figure 20. Simulated variation in PV output, vehicle demand, battery SOC, power export and import on 20/21 June for the case with 50 vehicles and 50 kWh battery.
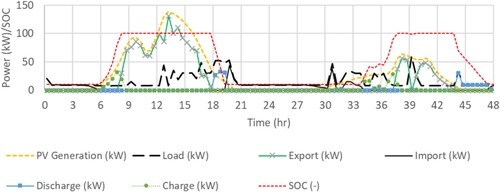
Figure 21. Average battery state of charge (expressed as a %) against battery size for different vehicle fleets.
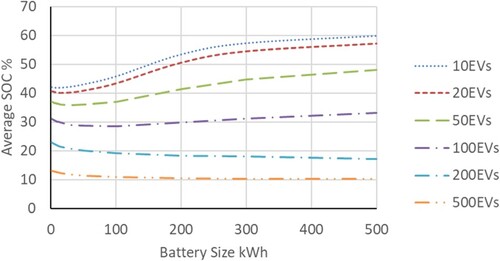
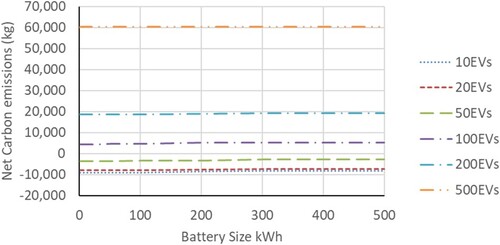
Figure 22. Net carbon emissions due to use of PV and battery against battery size for different vehicle fleets.
Table
Data availability statement
The data and modelling tools that support the findings of this study are available from DOI: 10.15129/21b5782d-a229-42f9-8f17-1f9a60f91197.