
Figures & data
Table 1. Description of TILLS subtests and Brown EF/A clusters most relevant to comprehensibility of classroom instruction.
Figure 1. Histogram indicating group distribution on the TILLS.
Note. Dashed line indicates normative mean (100) and 1 SD below (85). Scores to the left of this line indicate greater language difficulties.
Figure 2. Histogram indicating group distribution on the Brown EFA.
Note. Dashed line indicates normative mean (50) and one SD above (60), indicating greater difficulties.
Figure 3. Scatterplot of 59 student TILLS Total scores against Brown EF/A Total T-score.
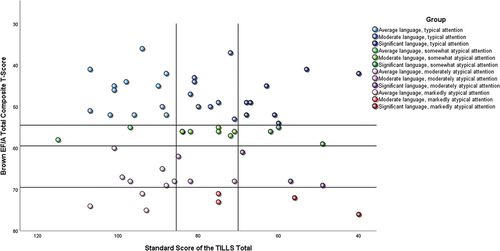
Figure 4. Frequency of TILLS subtest standard scores.
Note. Dotted line indicates normative mean (10) and 1 SD below the mean (7). VA = Vocabulary Awareness; DSF = Digit Span Forwards; DSB = Digit Span Backwards; FD = Following Directions; SR = Story Retelling; DSR = Delayed Story Retelling; LC = Listening Comprehension.
Table 2. Descriptive statistics and one sample t-tests on TILLS subtests.
Figure 5. Frequency of Brown EF/A cluster T-Scores.
Note. Dotted lines indicate normative T-score mean (50) and 1 SD above the mean (60). Vertical axis is reversed such that from top to bottom, data points represent greater attentional difficulties.
Table 3. Descriptive statistics and one sample t-tests on Brown EF/A clusters.
Table 4. Responses from students with average language and typical attention.