Figures & data
Figure 1. Outline of a session
Letters (A and B) indicate the two completed sub-sections. Roman numerals indicate individual activities chosen from a given sub-section per session.
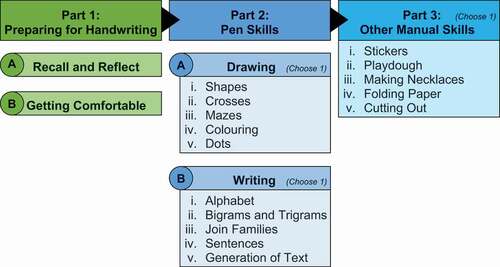
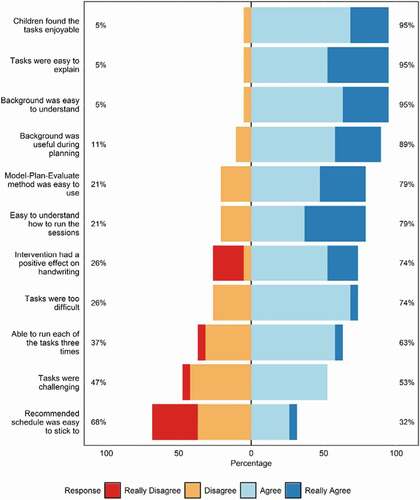
Figure 2. Responses to the feedback questionnaire
Percentages on the left relate to the number of people who answered ‘Really Disagree’ or ‘Disagree, whereas percentages on the right indicate ‘Agree’ or ‘Really Agree’ responses. Questions have been paraphrased here, though the full wording is preserved in Supplementary Material C.