6,465
Views
48
CrossRef citations to date
0
Altmetric
Report

Antibody humanization by structure-based computational protein design

, , , &
Pages 1045-1057 | Received 19 Mar 2015, Accepted 20 Jul 2015, Published online: 11 Sep 2015

Figures & data

Figure 1. Overview of the structure-based antibody humanization method. (left) Humanness is evaluated by the human string content (HSC) score,Citation7 which calculates aligned nonamer matches against human antibody germline sequences. (right) Structural stability is evaluated by rotameric energy, comprised of position-specific terms for rotamers at individual positions (side-chain internal energy plus backbone interaction) and pairs of positions (side-chain interactions). (center) Sets of mutations are chosen so as to make optimal trade-offs between the competing humanness and energy scores. Fab structures are colored bluer for higher HSC.

Figure 1. Overview of the structure-based antibody humanization method. (left) Humanness is evaluated by the human string content (HSC) score,Citation7 which calculates aligned nonamer matches against human antibody germline sequences. (right) Structural stability is evaluated by rotameric energy, comprised of position-specific terms for rotamers at individual positions (side-chain internal energy plus backbone interaction) and pairs of positions (side-chain interactions). (center) Sets of mutations are chosen so as to make optimal trade-offs between the competing humanness and energy scores. Fab structures are colored bluer for higher HSC.

Figure 2. HSC scores of antibody sequences. (A) The HSC scores of human (279 sequences), humanized (61), chimeric (32), and murine (513) antibodies are distinct. In general, scores for light chains are higher than those for heavy chains. Plots illustrate HSC distributions with the upper and lower quartiles as a box, the median as a thick center line, 1.5 times the interquartile range as whiskers, and outliers as circles. (B and C) Visualization of HSC scores within a Fab, where the higher the HSC score is, the more blue. (B) Murine antibody (aL2, 1I3G) with median murine HSC score of 79.4. (C) Human antibody (scFv 9004G, 2YC1) with median human HSC score of 90.7.
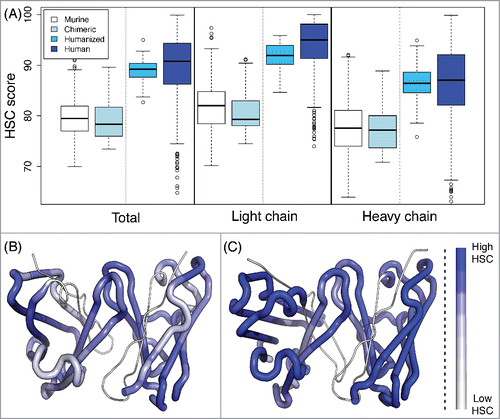
Figure 2. HSC scores of antibody sequences. (A) The HSC scores of human (279 sequences), humanized (61), chimeric (32), and murine (513) antibodies are distinct. In general, scores for light chains are higher than those for heavy chains. Plots illustrate HSC distributions with the upper and lower quartiles as a box, the median as a thick center line, 1.5 times the interquartile range as whiskers, and outliers as circles. (B and C) Visualization of HSC scores within a Fab, where the higher the HSC score is, the more blue. (B) Murine antibody (aL2, 1I3G) with median murine HSC score of 79.4. (C) Human antibody (scFv 9004G, 2YC1) with median human HSC score of 90.7.

Table 1. Retrospective test sets

Table 2. Humanization using homology models vs. crystal structures

Figure 3. Pareto optimal variants, trading off HSC score and energy at a range of mutational loads from predecessor sequences. (A) anti-CD30 (AC10); (B) anti-EGFR (Ab 225); (C) trastuzumab; (D) bevacizumab; (E) alemtuzumab. All humanized designs generated have energies that are better than or only marginally higher than the predecessor sequences.
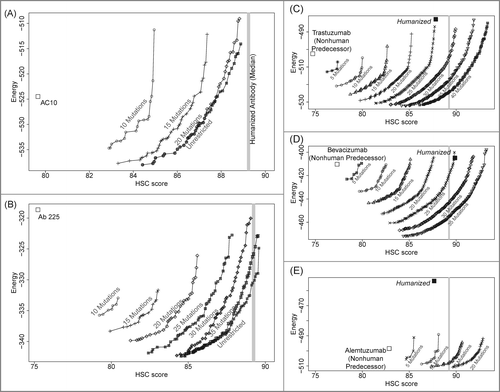
Figure 3. Pareto optimal variants, trading off HSC score and energy at a range of mutational loads from predecessor sequences. (A) anti-CD30 (AC10); (B) anti-EGFR (Ab 225); (C) trastuzumab; (D) bevacizumab; (E) alemtuzumab. All humanized designs generated have energies that are better than or only marginally higher than the predecessor sequences.

Figure 4. Sequence characteristics of humanized Ab 255 variants with unrestricted mutational load. (A) Mutation locations, with respect to a cartoon rendering of the Ab 255 model. There are 18 single mutations common to all 55 humanized designs (Cβ atoms as white spheres), 4 mutations unique to the 20 lowest HSC score designs (blue spheres), and 7 unique to the 20 highest HSC score designs (red spheres). (B) Pairwise sequence identities among the 55 humanized designs.
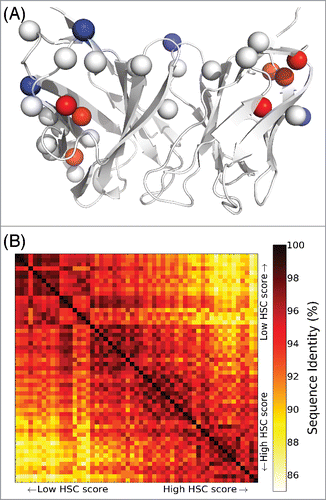
Figure 4. Sequence characteristics of humanized Ab 255 variants with unrestricted mutational load. (A) Mutation locations, with respect to a cartoon rendering of the Ab 255 model. There are 18 single mutations common to all 55 humanized designs (Cβ atoms as white spheres), 4 mutations unique to the 20 lowest HSC score designs (blue spheres), and 7 unique to the 20 highest HSC score designs (red spheres). (B) Pairwise sequence identities among the 55 humanized designs.

Figure 5. Humanized variants of TZ47. Initially 12 designs with 25 mutations were generated (A) and 4 diverse designs were selected according to a tree-based representation of sequence identity (B). Humanized variants are named according to the combination of (design # VH) / (design # VL). There are 2 unique light chains and 4 heavy chains; their possible combinations were also considered (A). Design 4 has 7 light-chain and 18 heavy-chain mutations, whereas Design 10 and 11 have 8 light and 17 heavy mutations. Thus the combinations 4H/10L and 9H/10L have 26 mutations in total (24 mutations for 11H/4L and 10H/4L) and are not on the Pareto optimal curve of designs with 25 mutations.
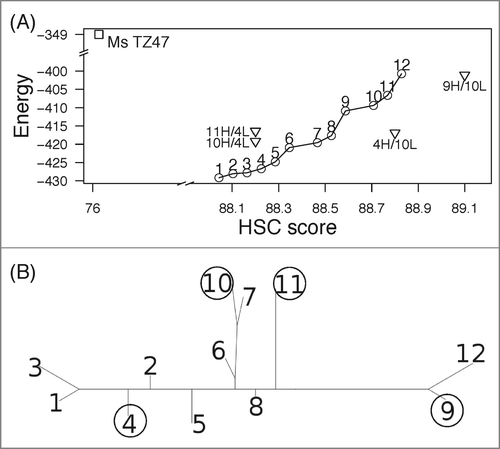
Figure 5. Humanized variants of TZ47. Initially 12 designs with 25 mutations were generated (A) and 4 diverse designs were selected according to a tree-based representation of sequence identity (B). Humanized variants are named according to the combination of (design # VH) / (design # VL). There are 2 unique light chains and 4 heavy chains; their possible combinations were also considered (A). Design 4 has 7 light-chain and 18 heavy-chain mutations, whereas Design 10 and 11 have 8 light and 17 heavy mutations. Thus the combinations 4H/10L and 9H/10L have 26 mutations in total (24 mutations for 11H/4L and 10H/4L) and are not on the Pareto optimal curve of designs with 25 mutations.

Table 3. Summary of expression and binding results for all humanized variants of the original murine TZ47 antibody

Figure 6. Validation of TZ47 variant binding activity and epitope specificity to soluble and cell-surface expressed B7H6. Shown are the normalized response curves for BLI testing at concentrations ranging from 26–1667 nM and histograms of fluorescence intensities of RMA-B7H6 cells stained with test antibody alone (solid color), test antibody +Ms TZ47 (dashed color), and secondary reagents only (solid gray) of the murine TZ47 (A), negative control VRC01 antibody (B), and humanized TZ47 variants (C).
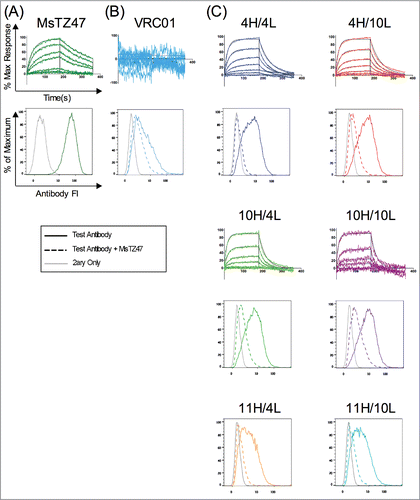
Figure 6. Validation of TZ47 variant binding activity and epitope specificity to soluble and cell-surface expressed B7H6. Shown are the normalized response curves for BLI testing at concentrations ranging from 26–1667 nM and histograms of fluorescence intensities of RMA-B7H6 cells stained with test antibody alone (solid color), test antibody +Ms TZ47 (dashed color), and secondary reagents only (solid gray) of the murine TZ47 (A), negative control VRC01 antibody (B), and humanized TZ47 variants (C).
Supplemental material

Supplemental_Material.docx

Download MS Word (2.8 MB)

Reprints and Corporate Permissions

Please note: Selecting permissions does not provide access to the full text of the article, please see our help page How do I view content?

To request a reprint or corporate permissions for this article, please click on the relevant link below:

Academic Permissions

Please note: Selecting permissions does not provide access to the full text of the article, please see our help page How do I view content?

Obtain permissions instantly via Rightslink by clicking on the button below:

If you are unable to obtain permissions via Rightslink, please complete and submit this Permissions form. For more information, please visit our Permissions help page.