Figures & data
Figure 1. Schematic diagram of the experimental workflow.
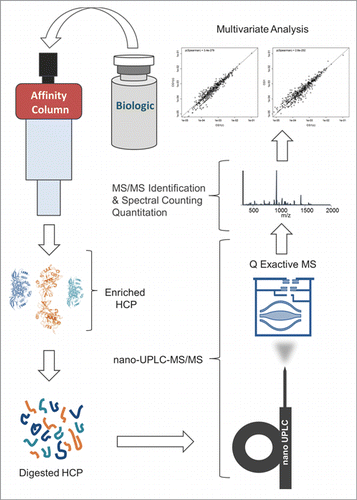
Figure 2. Counts of HCP identities versus total HCP content (ppm measurement by ELISA) as reported herein, as well as in previous LC-MS-based HCP studies. The previous works are labeled as follows: AnalBiochem2012,Citation5 mAbs2012,Citation11 RapCommMS2014,Citation14 BiotechProg2013,Citation4 PLoSOne2013,Citation10 and mAbs2014.Citation6 “ProtAdepl” and “ProtLdepl” represent the highest counts of HCPs identified in this report by either Protein A or Protein L depletion, respectively. The methodology presented in this article was able to detect ∼100 times more HCPs compared to other techniques that analyzed samples with low starting HCP concentrations (< 10 ppm range).
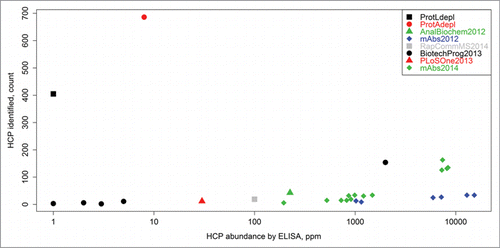
Figure 3. CHO cell lysate before and after Protein A depletion: (a) overlap of identified CHO proteins (b) correlation between abundances of individual HCPs detected in both samples.
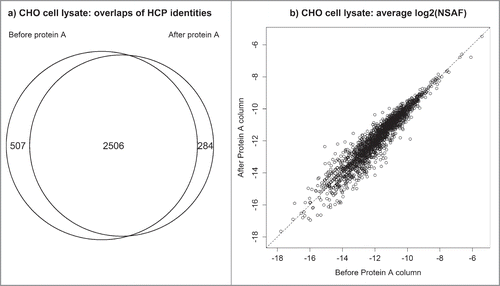
Figure 4. Jaccard distances and log base 10 of statistical significances of Spearman correlations between all samples analyzed in this study. Pairwise comparisons that have darker shades of purple have more HCP overlap (as seen in the Jaccard distance heat map) and are more significantly correlated with respect to individual protein abundances (as seen in the log10Pr(≥ρ) heat map); those that are more peach-colored, have less overlap and are less correlated, respectively.
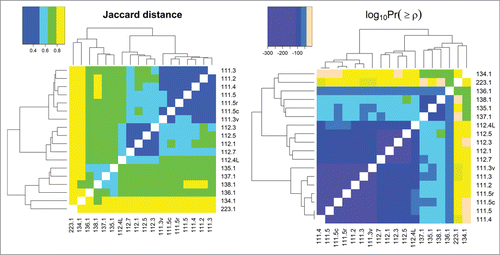
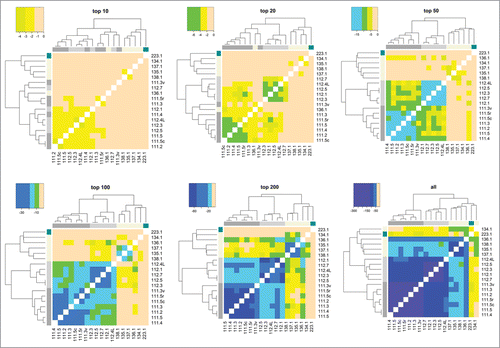
Figure 5. Illustration of how method resolution increases with increasing number of HCPs detected (using Spearman correlation).