1,486
Views
14
CrossRef citations to date
0
Altmetric
Report

A potent neutralizing IgM mAb targeting the N218 epitope on E2 protein protects against Chikungunya virus pathogenesis

, , , , &
Pages 1178-1194 | Received 09 Jun 2015, Accepted 11 Aug 2015, Published online: 18 Sep 2015

Figures & data

Figure 1. Characterization of mouse IgM mAbs in (A) IFA on CHIKV-infected BHK-21 cells and (B) indirect virion-based ELISA. (A) Purified mAbs produced from immunization of CHIKV was tested at 1:100 or 1:300 dilution in PBS. Rabbit anti-CHIKV E2 polyclonal IgG and mouse IgM isotype antibodies serve as positive and negative control, respectively. Cell nuclei were stained with DAPI while CHIKV antigens (white arrowhead) were secondarily stained with goat anti-mouse or anti-rabbit IgG FITC. Images were captured under 10x and 100x magnification and representative images from 2 independent experiments are shown. (B) Virion-based indirect ELISA. Sucrose-purified CHIKV were coated onto 96-well plate and incubated with anti-CHIKV IgMs, IgM isotype antibody or mouse anti-CHIKV E2 8A4 IgG mAb positive control at a range of 0.1 to 100 ng. 8A4 mAb was previously validated to be strongly positive for CHIKV binding in indirect ELISA.Citation67 The negative control consists of wells not coated with CHIKV. Absorbance value (Abs) was measured at 450 nm. Mean abs is derived from 3 independent experiments performed in duplicates and ± SD values are shown as error bars.
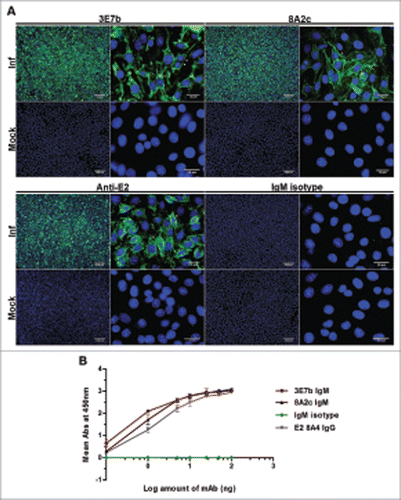
Figure 1. Characterization of mouse IgM mAbs in (A) IFA on CHIKV-infected BHK-21 cells and (B) indirect virion-based ELISA. (A) Purified mAbs produced from immunization of CHIKV was tested at 1:100 or 1:300 dilution in PBS. Rabbit anti-CHIKV E2 polyclonal IgG and mouse IgM isotype antibodies serve as positive and negative control, respectively. Cell nuclei were stained with DAPI while CHIKV antigens (white arrowhead) were secondarily stained with goat anti-mouse or anti-rabbit IgG FITC. Images were captured under 10x and 100x magnification and representative images from 2 independent experiments are shown. (B) Virion-based indirect ELISA. Sucrose-purified CHIKV were coated onto 96-well plate and incubated with anti-CHIKV IgMs, IgM isotype antibody or mouse anti-CHIKV E2 8A4 IgG mAb positive control at a range of 0.1 to 100 ng. 8A4 mAb was previously validated to be strongly positive for CHIKV binding in indirect ELISA.Citation67 The negative control consists of wells not coated with CHIKV. Absorbance value (Abs) was measured at 450 nm. Mean abs is derived from 3 independent experiments performed in duplicates and ± SD values are shown as error bars.

Figure 2. PRNT analysis of (A) complement-inactivated mice ascites and (B) purified IgM against CHIKV infection. Both ascites and purified IgM were 2-fold serially diluted in PBS before incubating with 100 PFU of CHIKV. Non-linear regression analysis of 3E7b and 8A2c are performed and best-fitted to dose-dependent inhibition curves (GraphPad Prism 6). Due to non-convergence of IgM isotype mAb data points, dose-inhibition curve is not applicable. (C) Grouped scatter plot of IC50 values from 3E7b and 8A2c non-linear regression describes quantitative evaluation of the mAb neutralizing potency. The thick line represents the mean value. (D) Post-CHIKV binding neutralization assay was performed by having CHIKV attached to BHK cells prior to 3E7b binding. Error bars are representative of ± SEM where at least 3 independent sets in duplicates were performed.
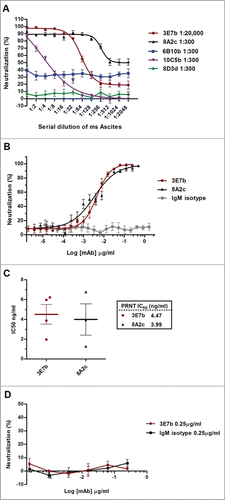
Figure 2. PRNT analysis of (A) complement-inactivated mice ascites and (B) purified IgM against CHIKV infection. Both ascites and purified IgM were 2-fold serially diluted in PBS before incubating with 100 PFU of CHIKV. Non-linear regression analysis of 3E7b and 8A2c are performed and best-fitted to dose-dependent inhibition curves (GraphPad Prism 6). Due to non-convergence of IgM isotype mAb data points, dose-inhibition curve is not applicable. (C) Grouped scatter plot of IC50 values from 3E7b and 8A2c non-linear regression describes quantitative evaluation of the mAb neutralizing potency. The thick line represents the mean value. (D) Post-CHIKV binding neutralization assay was performed by having CHIKV attached to BHK cells prior to 3E7b binding. Error bars are representative of ± SEM where at least 3 independent sets in duplicates were performed.
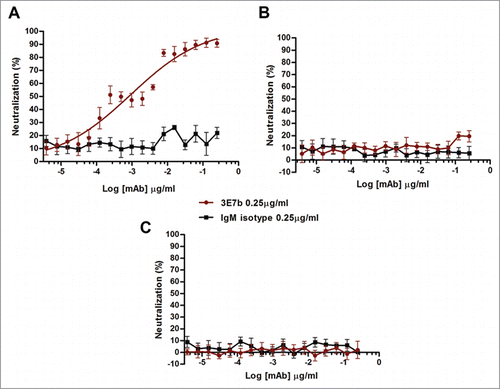
Figure 3. PRNT analysis of 3E7b IgM against (A) CHIKV Ross strain, (B) Sindbis virus (SINV) or (C) Ross River Virus (RRV). Non-linear regression analysis of 3E7b against CHIKV Ross strain is performed and best-fitted to dose-dependent inhibition curve. However due to wide variability, the derived IC50 is not applicable. Non-convergence analysis are obtained in (B) standard PRNT of SINV and (C) RRV at 100 PFU. Error bars are representative of ± SEM where at least 3 independent sets in duplicates were performed.

Figure 3. PRNT analysis of 3E7b IgM against (A) CHIKV Ross strain, (B) Sindbis virus (SINV) or (C) Ross River Virus (RRV). Non-linear regression analysis of 3E7b against CHIKV Ross strain is performed and best-fitted to dose-dependent inhibition curve. However due to wide variability, the derived IC50 is not applicable. Non-convergence analysis are obtained in (B) standard PRNT of SINV and (C) RRV at 100 PFU. Error bars are representative of ± SEM where at least 3 independent sets in duplicates were performed.

Figure 4. Identification of Escape Mutations in CHIKV E2. (A) PRNT was performed to investigate the escape ability of plaque-purified CHIKV/3E7b clone to mAb 3E7b. 2.5 μg/ml of 3E7b, 5 μg/ml of IgM isotype control or PBS (no mAb) was evaluated against a representative clone CHIKV/3E7b 1a diluted to 1000 PFU. One independent experiment was performed in duplicates as it is not possible to reproduce variability from the same mutant clone stock. CH stands for CHIKV while ~ indicates neutralization. (B) Sequencing chromatogram of CHIKV/3E7b 1a clone shows 3 single base A substitution in CHIKV E2 gene, which translates to E→D, N→D and D→G amino acid mutation at position 24, 218 and 233 of E2 protein, respectively. All CHIKV/3E7ba 1a-7a clones showed the same escape mutations at these residues when compared to sequences of wildtype CH122508 strain. No mutation was identified in CHIKV/PBS 1a, CHIKV/IgM 1a and 4a clones. Sequence analysis was performed using SeqTrace software.Citation63 8585, 9166 and 9186 refers to the nucleotide position. (C) Structural localization of 3E7b escape epitopes on CHIKV E1/E2 heterodimer modeled on CH122508 strain (GenBank Accession number: FJ445502). A top-down view is shown with E1 (orange), and E2- domain A (yellow), domain B (violet), C (cyan), beta-ribbon connectors (green) and transmembrane helix (gray). Arrow denotes the direction of E1/E2 protein complex relative to the viral membrane. Side-chain of escape residues, E24, N218 and D223, are presented as stick structures that show carbon and hydrogen atoms (white), oxygen atom (red) and nitrogen (blue). Amino acid distance is measured in angstroms (1Å = 0.1 nm) and figure is prepared using Pymol software.Citation65
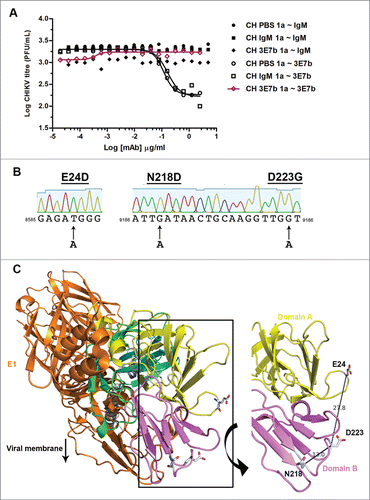
Figure 4. Identification of Escape Mutations in CHIKV E2. (A) PRNT was performed to investigate the escape ability of plaque-purified CHIKV/3E7b clone to mAb 3E7b. 2.5 μg/ml of 3E7b, 5 μg/ml of IgM isotype control or PBS (no mAb) was evaluated against a representative clone CHIKV/3E7b 1a diluted to 1000 PFU. One independent experiment was performed in duplicates as it is not possible to reproduce variability from the same mutant clone stock. CH stands for CHIKV while ~ indicates neutralization. (B) Sequencing chromatogram of CHIKV/3E7b 1a clone shows 3 single base A substitution in CHIKV E2 gene, which translates to E→D, N→D and D→G amino acid mutation at position 24, 218 and 233 of E2 protein, respectively. All CHIKV/3E7ba 1a-7a clones showed the same escape mutations at these residues when compared to sequences of wildtype CH122508 strain. No mutation was identified in CHIKV/PBS 1a, CHIKV/IgM 1a and 4a clones. Sequence analysis was performed using SeqTrace software.Citation63 8585, 9166 and 9186 refers to the nucleotide position. (C) Structural localization of 3E7b escape epitopes on CHIKV E1/E2 heterodimer modeled on CH122508 strain (GenBank Accession number: FJ445502). A top-down view is shown with E1 (orange), and E2- domain A (yellow), domain B (violet), C (cyan), beta-ribbon connectors (green) and transmembrane helix (gray). Arrow denotes the direction of E1/E2 protein complex relative to the viral membrane. Side-chain of escape residues, E24, N218 and D223, are presented as stick structures that show carbon and hydrogen atoms (white), oxygen atom (red) and nitrogen (blue). Amino acid distance is measured in angstroms (1Å = 0.1 nm) and figure is prepared using Pymol software.Citation65

Figure 5. Evaluation of mutant CHIKV binding and neutralization by mAb 3E7b. (A) Confluent BHK-21 cells were infected with CHIKV-WT, CHIKV-IVT, CHIKV-E24D, CHIKV-N218D or CHIKV-D223G clones at MOI 10. At day 1 p.i., cells were fixed and co-stained with 3E7b IgM and rabbit anti-E2 polyclonal antibody as a positive control. The difference in binding was visualized with goat anti-mouse IgM FITC and anti-rabbit IgG 594 secondary antibodies. Cell nuclei were stained DAPI and images were captured under 10x and 100x magnification. White arrowhead indicates reduced 3E7b binding. Representative images from 3 independent experiments are shown. (B) FITC signal of 3E7b binding is expressed as a percentage over 594 signal that represents the number of infected cells, n, quantitated. Error bars represent ± SD. One-way ANOVA followed by a post-Dunnett test, with statistical significance defined as ***p < 0.001. (C) PRNT of single mutant CHIKV clones was performed where 100 PFU of the respective CHIKV clone was neutralized with serially diluted 3E7b from 3.81 pg/ml to 0.25 μg/ml. Non-linear regression analysis was performed and data was best-fitted to dose-dependent inhibition curves for CHIKV-WT, CHIKV-IVT, CHIKV-E24D and CHIKV-D223G. Due to non-convergence of CHIKV-N218D data points, dose-inhibition curve and IC50 are not applicable. Mean value from at least 3 independent experiments performed in duplicates are presented. Error bars represent ± SEM.CH; CHIKV. a; ambiguous.
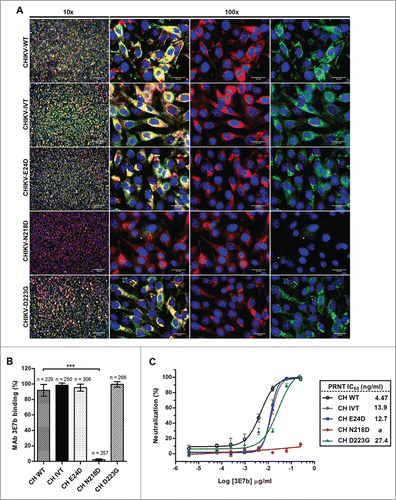
Figure 5. Evaluation of mutant CHIKV binding and neutralization by mAb 3E7b. (A) Confluent BHK-21 cells were infected with CHIKV-WT, CHIKV-IVT, CHIKV-E24D, CHIKV-N218D or CHIKV-D223G clones at MOI 10. At day 1 p.i., cells were fixed and co-stained with 3E7b IgM and rabbit anti-E2 polyclonal antibody as a positive control. The difference in binding was visualized with goat anti-mouse IgM FITC and anti-rabbit IgG 594 secondary antibodies. Cell nuclei were stained DAPI and images were captured under 10x and 100x magnification. White arrowhead indicates reduced 3E7b binding. Representative images from 3 independent experiments are shown. (B) FITC signal of 3E7b binding is expressed as a percentage over 594 signal that represents the number of infected cells, n, quantitated. Error bars represent ± SD. One-way ANOVA followed by a post-Dunnett test, with statistical significance defined as ***p < 0.001. (C) PRNT of single mutant CHIKV clones was performed where 100 PFU of the respective CHIKV clone was neutralized with serially diluted 3E7b from 3.81 pg/ml to 0.25 μg/ml. Non-linear regression analysis was performed and data was best-fitted to dose-dependent inhibition curves for CHIKV-WT, CHIKV-IVT, CHIKV-E24D and CHIKV-D223G. Due to non-convergence of CHIKV-N218D data points, dose-inhibition curve and IC50 are not applicable. Mean value from at least 3 independent experiments performed in duplicates are presented. Error bars represent ± SEM.CH; CHIKV. a; ambiguous.

Figure 6. Prophylactic evaluation of mAb 3E7b against CHIKV-induced lethality in a neonate mouse model. Five-day oldBALB/c mice were intraperitoneally (i.p.) injected with PBS, IgM isotype or mAb 3E7b at 24 h and 8 h prior to infection with CHIKV of 4 × 10Citation5 PFU via i.p. injection route. Infected mice were then monitored daily for their (A) survival and other clinical symtoms of CHIKV disease. Kaplan-Meier survival curves of the respective mAb dose are plotted and statistically analyzed by log-rank test (Graphpad prism 6). (B–F) Neonate mice were subjected to the same treatment and infection regimen as described. Serum and various tissues of infected mice were harvested at day 2 p.i and quantitated by CHIKV titer in standard plaque assay. Thick line represents the mean virus titer and dashed line indicates the limit of the detection in which data points on the x-axis refer to zero virus titer from zero plaque. Kruskal-Wallis test was performed across all treatment followed by a Dunn's post test to PBS infected control. Statistical significance is defined as *p < 0.05 and **p < 0.01 (GraphPad Prism 6).
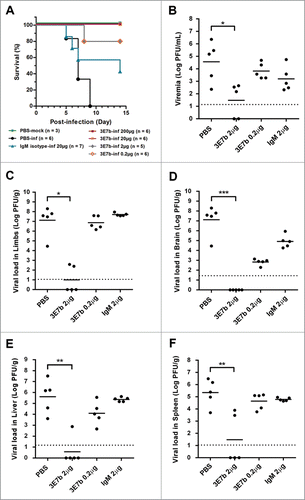
Figure 6. Prophylactic evaluation of mAb 3E7b against CHIKV-induced lethality in a neonate mouse model. Five-day oldBALB/c mice were intraperitoneally (i.p.) injected with PBS, IgM isotype or mAb 3E7b at 24 h and 8 h prior to infection with CHIKV of 4 × 10Citation5 PFU via i.p. injection route. Infected mice were then monitored daily for their (A) survival and other clinical symtoms of CHIKV disease. Kaplan-Meier survival curves of the respective mAb dose are plotted and statistically analyzed by log-rank test (Graphpad prism 6). (B–F) Neonate mice were subjected to the same treatment and infection regimen as described. Serum and various tissues of infected mice were harvested at day 2 p.i and quantitated by CHIKV titer in standard plaque assay. Thick line represents the mean virus titer and dashed line indicates the limit of the detection in which data points on the x-axis refer to zero virus titer from zero plaque. Kruskal-Wallis test was performed across all treatment followed by a Dunn's post test to PBS infected control. Statistical significance is defined as *p < 0.05 and **p < 0.01 (GraphPad Prism 6).

Figure 7. Histological analysis of limb muscles of mice pre-treated with 3E7b. Neonate mice that were mock-infected or pre-treated with PBS, 20 μg of IgM isotype or 3E7b were sacrificed on day 7 p.i. and harvested for their limbs. Limb muscles were paraformaldehyde-fixed, decalcified and processed according to the standard procedures for hematoxylin & eosin staining. Images are viewed and captured under 10× and 40× magnification of BX43 Olympus microscope. Representative images are shown with scale bar of 20 μm. b, bone; t, tendon.
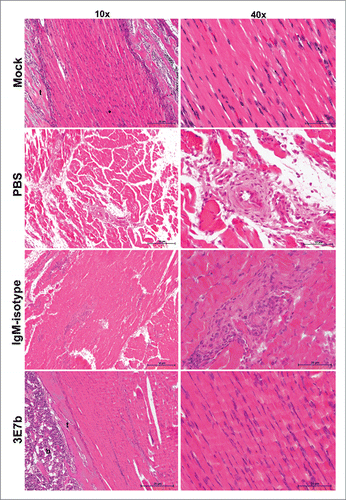
Figure 7. Histological analysis of limb muscles of mice pre-treated with 3E7b. Neonate mice that were mock-infected or pre-treated with PBS, 20 μg of IgM isotype or 3E7b were sacrificed on day 7 p.i. and harvested for their limbs. Limb muscles were paraformaldehyde-fixed, decalcified and processed according to the standard procedures for hematoxylin & eosin staining. Images are viewed and captured under 10× and 40× magnification of BX43 Olympus microscope. Representative images are shown with scale bar of 20 μm. b, bone; t, tendon.

Figure 8. Therapeutic evaluation of mAb 3E7b against CHIKV-induced lethality in a neonate mouse model. Six-day old BALB/c mice were i.p injected with CHIKV of 4 × 10⁵ PFU prior to administration of PBS, 20 μg of IgM isotype control or 3E7b at 8 h or 4 h p.i. (A) Survival (%) till 14 day p.i. is presented as Kaplan-Meier survival curves and statistically analyzed by log-rank test (GraphPad Prism 6). (B–F) Neonate mice were CHIKV-infected as described and post-treated with 20 μg of 3E7b at 4 h p.i. At day 2 p.i., serum and various tissues were harvested and quantitated for CHIKV titer. Thick line represents the mean virus titer and dashed line indicates the limit of the detection. Kruskal-Wallis test was performed across all treatment followed by a Dunn's post test to PBS infected control. Statistical significance is defined as *p < 0.05 and **p < 0.01 (GraphPad Prism 6).
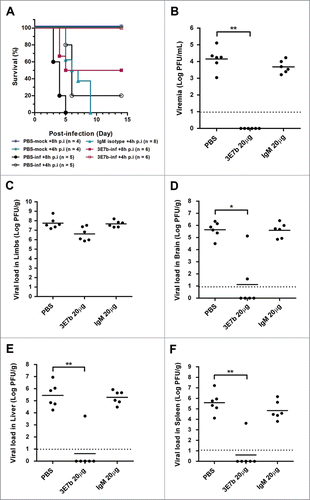
Figure 8. Therapeutic evaluation of mAb 3E7b against CHIKV-induced lethality in a neonate mouse model. Six-day old BALB/c mice were i.p injected with CHIKV of 4 × 10⁵ PFU prior to administration of PBS, 20 μg of IgM isotype control or 3E7b at 8 h or 4 h p.i. (A) Survival (%) till 14 day p.i. is presented as Kaplan-Meier survival curves and statistically analyzed by log-rank test (GraphPad Prism 6). (B–F) Neonate mice were CHIKV-infected as described and post-treated with 20 μg of 3E7b at 4 h p.i. At day 2 p.i., serum and various tissues were harvested and quantitated for CHIKV titer. Thick line represents the mean virus titer and dashed line indicates the limit of the detection. Kruskal-Wallis test was performed across all treatment followed by a Dunn's post test to PBS infected control. Statistical significance is defined as *p < 0.05 and **p < 0.01 (GraphPad Prism 6).

Figure 9. Histological analysis of limb muscles of mice post-treated with 3E7b after CHIKV infection. As described previously, limb muscles of infected mice at day 7 p.i. were harvested, fixed and processed for hematoxylin & eosin staining as described. Images are viewed and captured under 10× and 40× magnification of BX43 Olympus microscope. Representative images are shown with scale bar of 20 μm. Black arrowhead points to inflammatory cell. t, tendon.
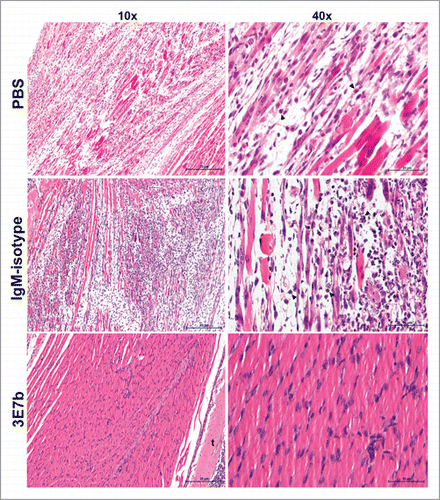
Figure 9. Histological analysis of limb muscles of mice post-treated with 3E7b after CHIKV infection. As described previously, limb muscles of infected mice at day 7 p.i. were harvested, fixed and processed for hematoxylin & eosin staining as described. Images are viewed and captured under 10× and 40× magnification of BX43 Olympus microscope. Representative images are shown with scale bar of 20 μm. Black arrowhead points to inflammatory cell. t, tendon.
Supplemental material

Supplemental_Material.docx

Download MS Word (1.2 MB)

Reprints and Corporate Permissions

Please note: Selecting permissions does not provide access to the full text of the article, please see our help page How do I view content?

To request a reprint or corporate permissions for this article, please click on the relevant link below:

Academic Permissions

Please note: Selecting permissions does not provide access to the full text of the article, please see our help page How do I view content?

Obtain permissions instantly via Rightslink by clicking on the button below:

If you are unable to obtain permissions via Rightslink, please complete and submit this Permissions form. For more information, please visit our Permissions help page.