Figures & data
Figure 1. Illustration of cysteine-conjugated ADCs with various drug load distributions. Reduction of inter-chain disulfide bonds allows the conjugation of drugs through a maleimide-containing linker via the newly generated sulfhydryl groups. Conjugation of drugs via reduced inter-chain disulfide bonds generate ADCs with expected drug loads occurring in intervals of 2, 4, 6, and 8 with associated possible positional isomers.
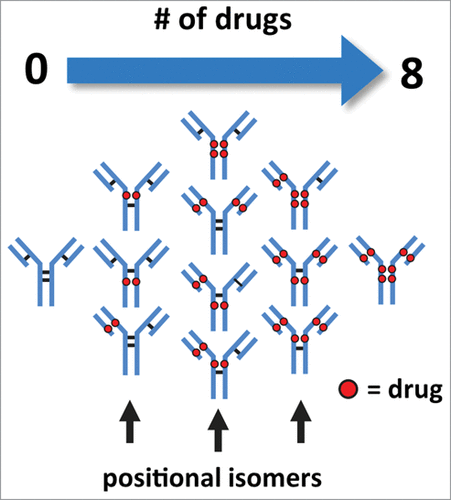
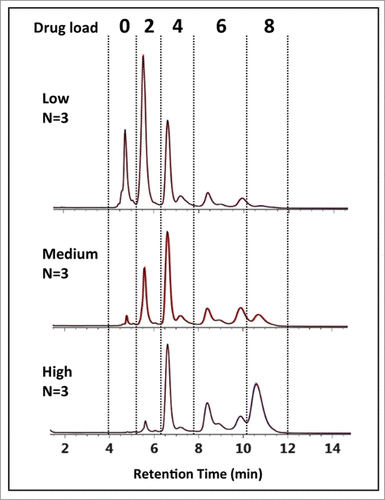
Figure 2. HIC chromatograms showing distribution profiles of cysteine-conjugated ADCs. Three batches of ADCs were synthesized, each with a different level of drug load (Low-, Medium-, and High-loaded) and analyzed using a 10 min gradient with a HIC column, 4.6 × 100 mm, 2.5 µm (see experimental). The distribution profiles exhibited multiple peaks that differed from expected profiles preventing unambiguous correlation of DAR 2, 4, 6, and 8 species with the peaks (B)–(H).
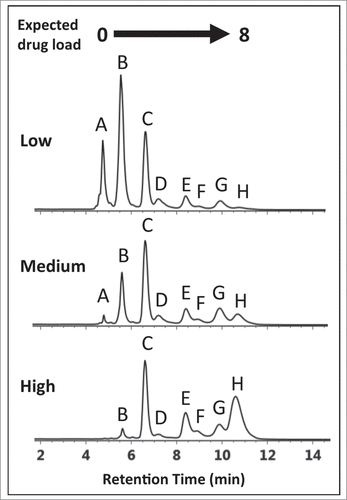
Table 1. Multidimensional analysis. HIC separation in the 1st dimension (y-axis) separates cysteine-conjugated ADCs based on their hydrophobicity associated with increasing DAR species. When subjected to an orthogonal 2nd dimension (x-axis) separation such as RPLC-MS, cysteine-conjugated ADCs dissociate into their respective sub-units due to denaturation by the mobile phases and temperature employed. The discrete masses generated from the unique sub-units for each conjugated species facilitate structural identification of positional isoforms associated with cysteine-conjugated ADCs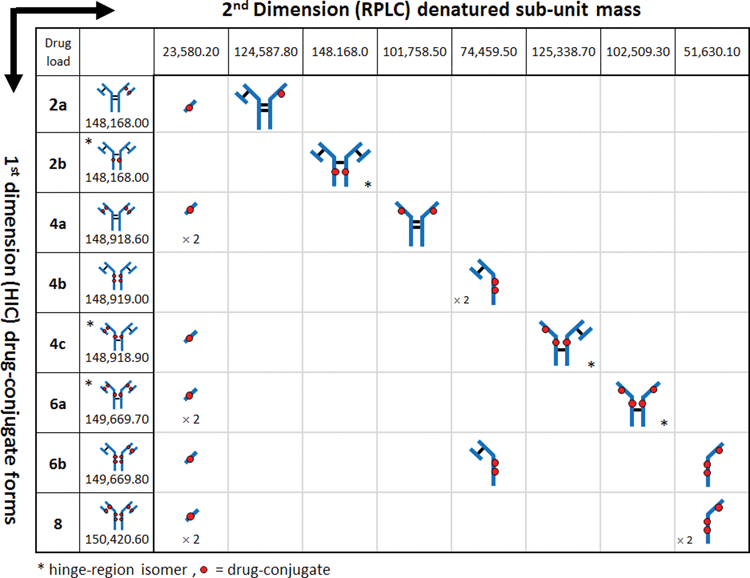
Table 2. Drug-to-antibody ratio determination. Individual DAR contributions for each drug loaded species (e.g., DAR 0, 2, 4, 6, 8) was calculated based on the sum relative peak area for the distribution species denoted by the dashed lines in The average DARs were determined to be 2.83, 4.44, and 5.97 for the low-, medium-, and high-loaded ADC batches, respectively
Figure 3. Instrument configuration schematic. (A) A column manager housing two 6-port 2-position valves was configured as illustrated by the schematic to perform heart-cuts of the 1st dimension separation. Valve position is denoted numerically as position 1 and 2. Abbreviations are defined as QSM: quaternary solvent manager, AS: auto sampler, TUV: tunable ultraviolet detector, BSM: binary solvent manager, RP: regenerative pump, MS: mass spectrometer. (B) Heart-cuts were performed in 0.2 minute intervals at or near the apex of the peak under investigation. An example of the heart-cut being performed on peak (C) from is illustrated in the example. The heart-cut was bracketed with a 3 second interval to purge residual ammonium sulfate in the fluidic path post 1st dimension column.
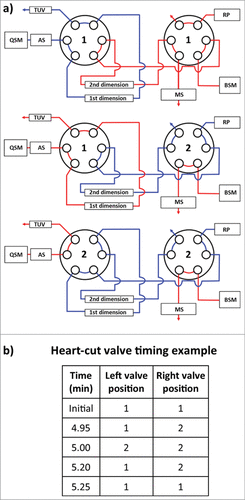
Figure 4. ADC analysis using an LC(HIC)/LC(RP)/QTOF-MS approach. (A) A 0.20 min heart-cut (100 µL) was initiated post-apex on the latest eluting peak from the HIC separation (peak (H)) of the high cysteine-conjugated ADC batch. (B) The transferred fraction was desalted and separated using a 15 min gradient by RPLC with expected dissociated sub-units shown in the inset. (C) MS spectra were deconvoluted and determined to be indicative of the light-chain (23,580.0 Da) and heavy-chain (51,630.6 Da) containing 1 and 3 drugs, respectively.
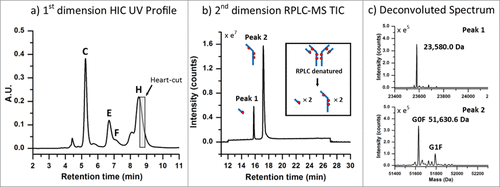
Figure 5. Positional isoform identification using HIC/RP/QTOF-MS. (A) A 0.20 min heart-cut fraction of peak (F) dissociated into 3 unique sub-unit masses under RPLC conditions which corresponded to an ADC with 6 drugs (DAR 6) as illustrated by the isoform structure provided. (B) A 0.20 min heart-cut fraction of peak (E) was also determined to be an isomer of DAR 6 with the corresponding structure shown in the illustration. (C) A 0.20 min heart-cut of peak (C) was confirmed to be an ADC bearing 4 drugs with both light-chain and their corresponding heavy-chain sulfhydryl sites occupied with drugs as shown in the illustration.
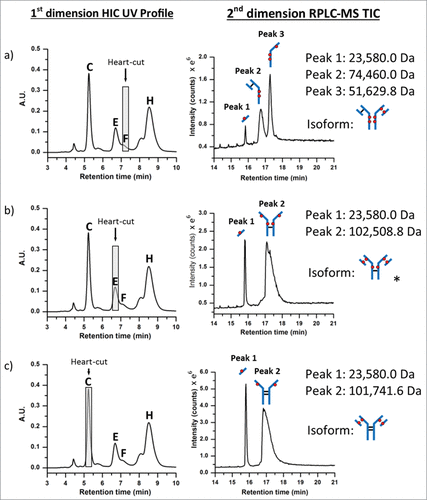
Figure 6. HIC-UV assessment of drug load distribution. Using peak identification determined from the multidimensional chromatography-MS method, drug load distribution was assessed in triplicate for the 3 batches of cysteine-conjugated ADCs. Overlays of the chromatograms (black, red, blue) are shown to demonstrate the reproducibility and robustness of the methodology.
