2,916
Views
13
CrossRef citations to date
0
Altmetric
Report

Rapid quantitative analysis of monoclonal antibody heavy and light chain charge heterogeneity

, &
Pages 1118-1127 | Received 12 Jun 2015, Accepted 17 Aug 2015, Published online: 18 Sep 2015

Figures & data

Figure 1. RD-SEC elution profiles as a function of flow rate (A & B) and ionic strength (C & D). Five hundred milligrams of reduced and denatured mAb-1 was injected into 2 Shodex 802.5 columns pre-equilibrated with 8 M urea, 2 mM DTT, and 10 mM HEPES, pH 7.5 and eluted with a flow rate of (A) 0.25 mL/min or (B) 0.425 mL/min. The effect of ionic strength was examined under similar conditions except the buffer was (C) 10 mM and (D) 35 mM sodium acetate, pH 4.5.
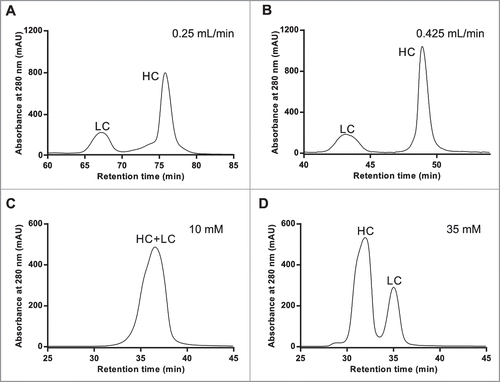
Figure 1. RD-SEC elution profiles as a function of flow rate (A & B) and ionic strength (C & D). Five hundred milligrams of reduced and denatured mAb-1 was injected into 2 Shodex 802.5 columns pre-equilibrated with 8 M urea, 2 mM DTT, and 10 mM HEPES, pH 7.5 and eluted with a flow rate of (A) 0.25 mL/min or (B) 0.425 mL/min. The effect of ionic strength was examined under similar conditions except the buffer was (C) 10 mM and (D) 35 mM sodium acetate, pH 4.5.

Figure 2. Demonstration of antibody specific optimization of RD-SEC by screening different mobile phase pH's. One hundred milligrams of reduced and denatured mAb-1 was injected into 2 Shodex 802.5 columns pre-equilibrated with 8 M urea, 2 mM DTT, and (A) 10 mM MES, pH 6.0, (B) 10 mM MOPS, pH 7.0, (C) 10 mM MOPS, pH 8.0, and (D) 10 mM HEPES, pH 9.0.
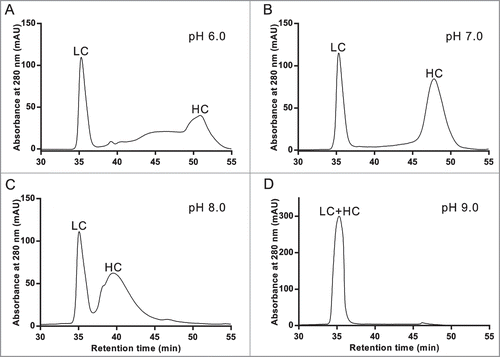
Figure 2. Demonstration of antibody specific optimization of RD-SEC by screening different mobile phase pH's. One hundred milligrams of reduced and denatured mAb-1 was injected into 2 Shodex 802.5 columns pre-equilibrated with 8 M urea, 2 mM DTT, and (A) 10 mM MES, pH 6.0, (B) 10 mM MOPS, pH 7.0, (C) 10 mM MOPS, pH 8.0, and (D) 10 mM HEPES, pH 9.0.

Figure 3. Correlation between the difference in heavy and light chain elution volumes with difference in isoelectric points. The chromatographic separation of 9 different monoclonal antibodies under reducing and denaturing conditions was optimized to determine the difference in elution volume between the heavy and light chains (ΔVelu). These values are plotted against the difference in theoretical pI values between the heavy and light chains. The linear correlation line (r2 = 0.92) was determine from 7 mAbs (circles); 2 mAbs (triangles) were excluded from the regression.
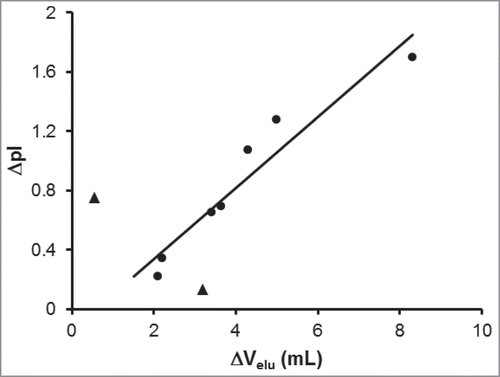
Figure 3. Correlation between the difference in heavy and light chain elution volumes with difference in isoelectric points. The chromatographic separation of 9 different monoclonal antibodies under reducing and denaturing conditions was optimized to determine the difference in elution volume between the heavy and light chains (ΔVelu). These values are plotted against the difference in theoretical pI values between the heavy and light chains. The linear correlation line (r2 = 0.92) was determine from 7 mAbs (circles); 2 mAbs (triangles) were excluded from the regression.

Figure 4. Chromatographic separation of reduced and denatured heavy and light chains in sufficient amounts for icIEF is possible with RD-SEC. Increasing amounts, from 0.1 milligrams to 1.5 milligrams, of reduced and denatured mAb-2 was separated under previously optimized conditions (8 M urea, 1 mM TCEP, and 35 mM sodium citrate, pH 6.0; 0.425 mL/min flow rate).
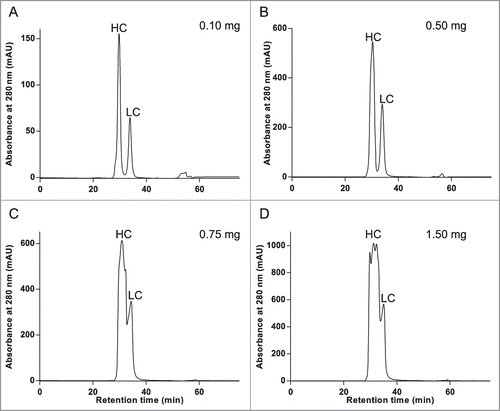
Figure 4. Chromatographic separation of reduced and denatured heavy and light chains in sufficient amounts for icIEF is possible with RD-SEC. Increasing amounts, from 0.1 milligrams to 1.5 milligrams, of reduced and denatured mAb-2 was separated under previously optimized conditions (8 M urea, 1 mM TCEP, and 35 mM sodium citrate, pH 6.0; 0.425 mL/min flow rate).

Figure 5. Imaged capillary isoelectric focusing (icIEF) of chromatographically separated reduced and denatured mAb-2 heavy and light chains. Pooled RD-SEC fractions containing either (A) heavy or (B) light chain protein were focused for 8 minutes on an iCE280 Analyzer. For comparison, the corresponding 2D-PAGE is shown in C.
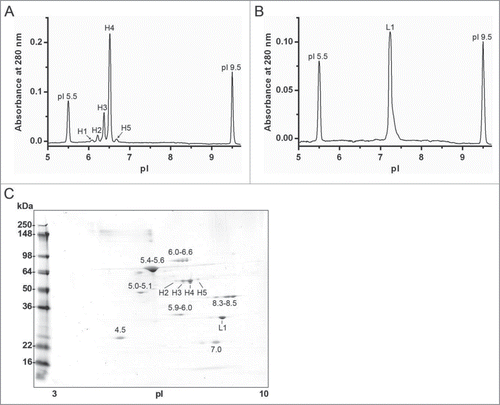
Figure 5. Imaged capillary isoelectric focusing (icIEF) of chromatographically separated reduced and denatured mAb-2 heavy and light chains. Pooled RD-SEC fractions containing either (A) heavy or (B) light chain protein were focused for 8 minutes on an iCE280 Analyzer. For comparison, the corresponding 2D-PAGE is shown in C.

Table 1. Summary of isoelectric focusing of mAb-2 heavy chain by imaged capillary isoelectric focusing

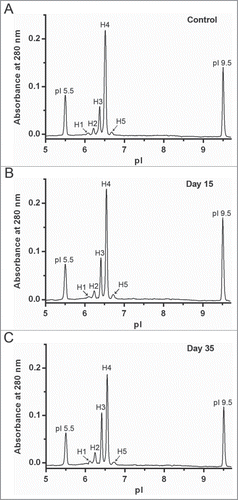
Figure 6. Assessment of accelerated stability studies using ChromiCE. mAb-2 was incubated at 45°C and processed for ChromiCE to provide quantitative charge variant analysis at specific time points.

Figure 6. Assessment of accelerated stability studies using ChromiCE. mAb-2 was incubated at 45°C and processed for ChromiCE to provide quantitative charge variant analysis at specific time points.
Supplemental material

Supplemental_Material.pdf

Download PDF (239.3 KB)

Reprints and Corporate Permissions

Please note: Selecting permissions does not provide access to the full text of the article, please see our help page How do I view content?

To request a reprint or corporate permissions for this article, please click on the relevant link below:

Academic Permissions

Please note: Selecting permissions does not provide access to the full text of the article, please see our help page How do I view content?

Obtain permissions instantly via Rightslink by clicking on the button below:

If you are unable to obtain permissions via Rightslink, please complete and submit this Permissions form. For more information, please visit our Permissions help page.