Figures & data
Figure 1. Schematic representation of the overall strategy for N-glycan analysis of the Protein Test Article using CE-LIF. 1) Peptide N-glycosidase F-mediated release of N-linked carbohydrates was followed by 2) a rapid reductive amination-based labeling reaction with APTS. 3) In the next step, salts and unbound dye molecules are removed from the sample and the APTS derivatized glycans are eluted by HPLC-grade water. 4) Finally, the samples are analyzed by CE-LIF.
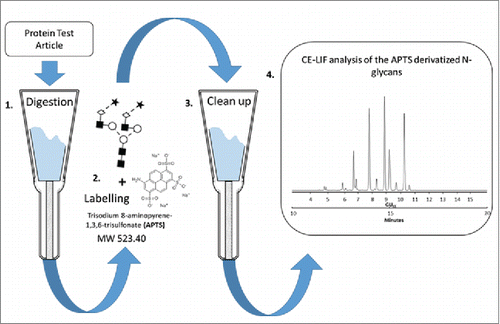
Table 1. Inter-laboratory reproducibility for relative peak areas, including all participating laboratories. An elevated %RSD is observed for some peaks due to the inclusion of results from outlying sites.
Figure 2. CE-LIF analysis of APTS-labeled partitioned N-glycan libraries of high-mannose (upper trace), fucosyl biantennary (lower trace) and afucosyl biantennary (middle trace) structures. All identified N-glycan structures are listed in the right panel with their Oxford notation.Citation9 Commonly used names (highlighted by red in brackets) are also given for structures that can usually be found on therapeutic antibodies.
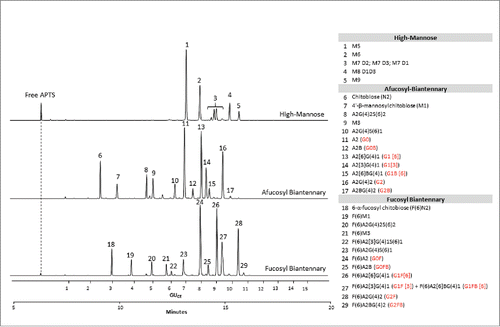
Figure 3. CE-LIF analysis trace of the APTS-labeled N-glycan profile of the Protein Test Article. The 20 most-abundant peaks were integrated in all the submitted profiles and their migration times and relative and total areas were then used to determine internal precision and reproducibility of the N-glycan mapping assay. The right panel shows the corresponding GUCE values for all integrated peaks in their migration order, as well as the name of all identified structures using Oxford notation.Citation9
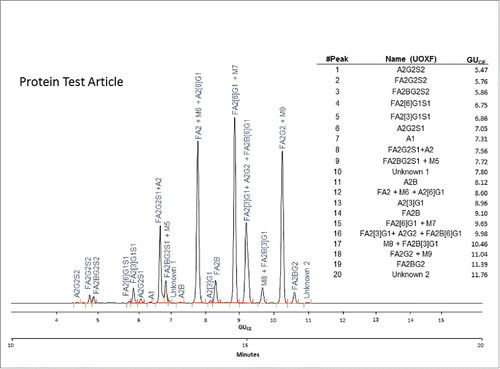
Figure 4. Statistical analysis of site F. Three chemical replicates were prepared; 3 injections were performed for each replicate. (A) Relative peak area for each integrated peak. (B) Absolute peak areas for each integrated peak. (C) Total peak area of each replicate.
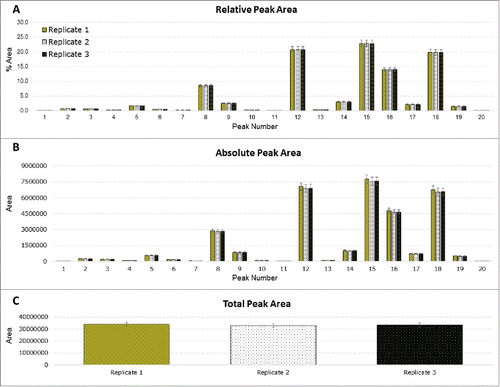
Figure 5. Grubb's test for %Area of peak 15 in the Protein Test Article by sites and replicates. Red columns represent those replicate samples of site S where the %Area value of peak 15 were considered.
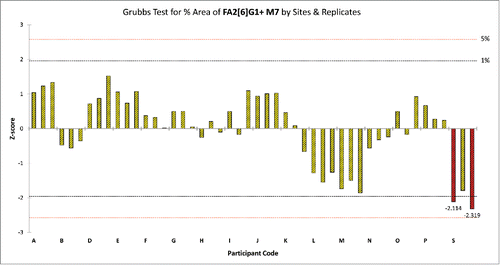
Figure 6. Identification of outlying relative %Area values for all sites and peaks. Peaks are listed in their migration order. If a site had more than 5 outlier values in its data set, the results obtained from that site were removed from the data set and were not used in further calculations. Since site A obtained outlying %Area values (highlighted by blue) for 12 peaks its data were rejected and were not used during the final calculation of assay repeatability and reproducibility.
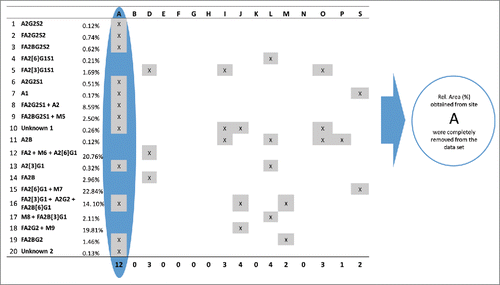
Table 2. Reproducibility of the G2 (maltose) peak of the pre-labeled malto-oligomer ladder by sites. The table contains the mean values obtained from summarizing up 6 consecutive injections carried out by each site. No outlier analysis was performed on the data set before calculating the overall means. (USP: United States Pharmacopeial Convention)
Table 3. Summary of %Area, migration time repeatability and reproducibility values obtained from the Multi-Site N-Glycan study. (A) Summary of the overall mean %Area values for the 20 most-abundant peaks and their repeatability and reproducibility. (B) Summary of the calculated general mean migration times and their reproducibility and repeatability by peaks.
