2,458
Views
27
CrossRef citations to date
0
Altmetric
Reports

A human monoclonal antibody against small envelope protein of hepatitis B virus with potent neutralization effect

, , , , , , , , , , , , & show all
Pages 468-477 | Received 29 Sep 2015, Accepted 15 Dec 2015, Published online: 04 Mar 2016

Figures & data

Figure 1. Characterization of 21 human anti-S mAbs to identify those with high affinity for the S protein. (A) ELISA method. Purified S protein (red) or anti-human Fab antibody (blue) were coated on 96-well plates, and incubated with human Fab antibodies. Bound antibodies were revealed by HRP-conjugated anti-human Fab. (B) SPR method. HBIgG12 and HBIgG21 at various concentrations were applied to BIAcore 3000 sensor chip CM5 immobilized with S protein. Each measurement represents an average of 3 independent assays.
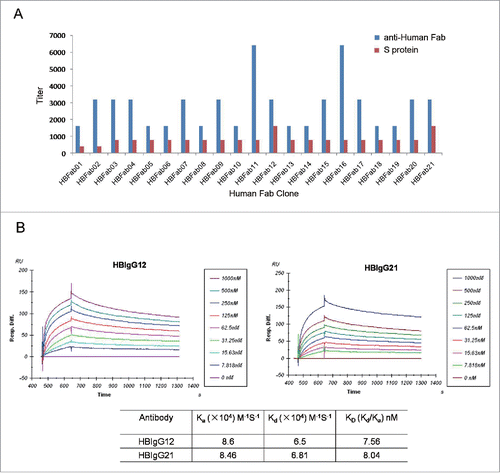
Figure 1. Characterization of 21 human anti-S mAbs to identify those with high affinity for the S protein. (A) ELISA method. Purified S protein (red) or anti-human Fab antibody (blue) were coated on 96-well plates, and incubated with human Fab antibodies. Bound antibodies were revealed by HRP-conjugated anti-human Fab. (B) SPR method. HBIgG12 and HBIgG21 at various concentrations were applied to BIAcore 3000 sensor chip CM5 immobilized with S protein. Each measurement represents an average of 3 independent assays.

Figure 2. G12 can recognize HBsAg from different HBV genotypes and vast majority of clinical samples. ((A)& B) Huh7 cells were transfected with 1.3 copies of the HBV genome belonging to genotype A-F and H, followed by IF staining of intracellular envelope proteins by G12 (A) and ELISA detection of HBsAg released to culture supernatant using G12 coated plate (B). The three images for panel A are, from left to right, nuclear staining by DAPI (blue), HBsAg staining by G12 followed by FITC-conjugated anti-human antibody (green), and merged images. Each bar represents 10μm. Cells transfected with pUC18 DNA served as a negative control (Mock). (C) G12-based ELISA to detect HBsAg from 198 serum samples. The horizontal axis shows amounts of HBsAg (ng/ml) based on Light Initiated Chemiluminescence Analyzing System (Bo Yang), while vertical axis represents values (S/CO) from ELISA with G12-coated plates. For G12-based ELISA the cutoff value was 2.1 times the average of negative controls, and samples with S/CO >1 were scored positive (dotted line). S/CO: signal over cutoff.
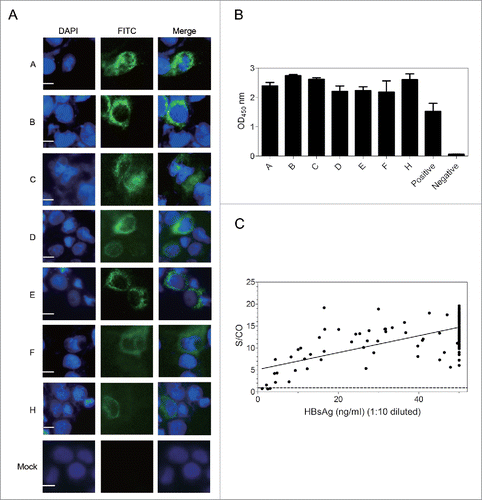
Figure 2. G12 can recognize HBsAg from different HBV genotypes and vast majority of clinical samples. ((A)& B) Huh7 cells were transfected with 1.3 copies of the HBV genome belonging to genotype A-F and H, followed by IF staining of intracellular envelope proteins by G12 (A) and ELISA detection of HBsAg released to culture supernatant using G12 coated plate (B). The three images for panel A are, from left to right, nuclear staining by DAPI (blue), HBsAg staining by G12 followed by FITC-conjugated anti-human antibody (green), and merged images. Each bar represents 10μm. Cells transfected with pUC18 DNA served as a negative control (Mock). (C) G12-based ELISA to detect HBsAg from 198 serum samples. The horizontal axis shows amounts of HBsAg (ng/ml) based on Light Initiated Chemiluminescence Analyzing System (Bo Yang), while vertical axis represents values (S/CO) from ELISA with G12-coated plates. For G12-based ELISA the cutoff value was 2.1 times the average of negative controls, and samples with S/CO >1 were scored positive (dotted line). S/CO: signal over cutoff.

Figure 3. Mapping the epitope of G12 using 38 deletion mutants of the S gene. The S gene was cloned to pcDNA3.1-flag vector and 38 consecutive deletion mutants with every 6 residues removed (with the exceptions of mutant 2–6 and mutant 223–226) were generated and transfected to Huh7 cells. (A) Cells were harvested 48 hours later and lysed with RIPA buffer for S protein detection by both G12-based ELISA (white bars) and KHB ELISA (black bars) without dilution. (B) Corresponding culture supernatant was diluted 1:5 for S protein detection by G12 based ELISA (white bars) and commercial KHB ELISA (black bars). Signals below the dotted line are considered as negative. S/CO: signal over cutoff.
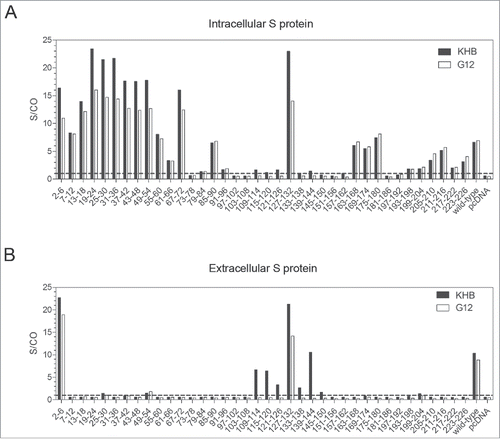
Figure 3. Mapping the epitope of G12 using 38 deletion mutants of the S gene. The S gene was cloned to pcDNA3.1-flag vector and 38 consecutive deletion mutants with every 6 residues removed (with the exceptions of mutant 2–6 and mutant 223–226) were generated and transfected to Huh7 cells. (A) Cells were harvested 48 hours later and lysed with RIPA buffer for S protein detection by both G12-based ELISA (white bars) and KHB ELISA (black bars) without dilution. (B) Corresponding culture supernatant was diluted 1:5 for S protein detection by G12 based ELISA (white bars) and commercial KHB ELISA (black bars). Signals below the dotted line are considered as negative. S/CO: signal over cutoff.

Figure 4. Neutralization of HBV infectivity in HepaRG cells (A) and HepG2/NTCP cells (B) by G12 or HBIG. Cells seeded in 96-well plates were incubated overnight with cell culture derived HBV particles in the absence or presence of serial 4-fold dilutions of G12 or HBIG, or control antibody (Cont. Ab). Cells were washed and further cultured with medium change every 2 or 3 d HBeAg values at one week post-infection were measured using an ELISA kit (KHB). The cutoff value (2.1 times the negative control) is shown as dotted line. Please note that the concentration of G12 shown is μg/ml, whereas that of HBIG is mg/ml.
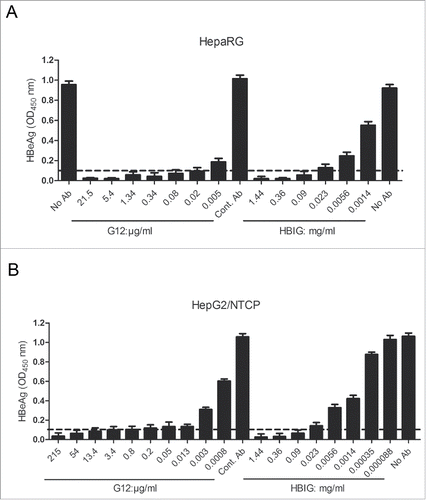
Figure 4. Neutralization of HBV infectivity in HepaRG cells (A) and HepG2/NTCP cells (B) by G12 or HBIG. Cells seeded in 96-well plates were incubated overnight with cell culture derived HBV particles in the absence or presence of serial 4-fold dilutions of G12 or HBIG, or control antibody (Cont. Ab). Cells were washed and further cultured with medium change every 2 or 3 d HBeAg values at one week post-infection were measured using an ELISA kit (KHB). The cutoff value (2.1 times the negative control) is shown as dotted line. Please note that the concentration of G12 shown is μg/ml, whereas that of HBIG is mg/ml.
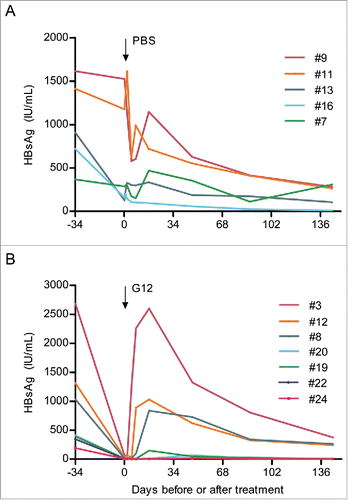
Figure 5. Effect of PBS and G12 treatment on serum HBsAg titers in lineage 59 HBV transgenic mice. (A) Sequential serum HBsAg titers in 5 mice receiving intraperitoneal injection of PBS. (B) Sequential serum HBsAg titers in 7 mice receiving intraperitoneal injection of 600 IU of G12.

Figure 5. Effect of PBS and G12 treatment on serum HBsAg titers in lineage 59 HBV transgenic mice. (A) Sequential serum HBsAg titers in 5 mice receiving intraperitoneal injection of PBS. (B) Sequential serum HBsAg titers in 7 mice receiving intraperitoneal injection of 600 IU of G12.

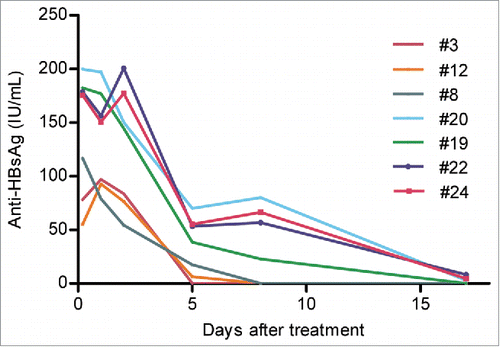
Figure 6. Sequential serum anti-HBs titers in 7 lineage 59 HBV transgenic mice receiving intraperitoneal injection of 600 IU of G12. Shown are anti-HBs titers from 0.2 day (5 hours) to 17 d post-injection.

Figure 6. Sequential serum anti-HBs titers in 7 lineage 59 HBV transgenic mice receiving intraperitoneal injection of 600 IU of G12. Shown are anti-HBs titers from 0.2 day (5 hours) to 17 d post-injection.
Supplemental material

KMAB_A_1134409_SO4.docx

Download MS Word (55.6 KB)

KMAB_A_1134409_SO3.docx

Download MS Word (69.6 KB)

KMAB_A_1134409_SO2.docx

Download MS Word (78.3 KB)

Reprints and Corporate Permissions

Please note: Selecting permissions does not provide access to the full text of the article, please see our help page How do I view content?

To request a reprint or corporate permissions for this article, please click on the relevant link below:

Academic Permissions

Please note: Selecting permissions does not provide access to the full text of the article, please see our help page How do I view content?

Obtain permissions instantly via Rightslink by clicking on the button below:

If you are unable to obtain permissions via Rightslink, please complete and submit this Permissions form. For more information, please visit our Permissions help page.