1,823
Views
11
CrossRef citations to date
0
Altmetric
Reports

Pregnancy-specific glycoprotein expression in normal gastrointestinal tract and in tumors detected with novel monoclonal antibodies

, , , , , , , , , , , , , & show all
Pages 491-500 | Received 02 Nov 2015, Accepted 16 Dec 2015, Published online: 18 Mar 2016

Figures & data

Figure 1. Western blot of 1st, 2nd and 3rd trimester maternal pregnant sera, non-pregnant female serum (NP), and male serum (M), probed with mAb PSG.05 (A) and mAb PSG.11 (B). Immunohistochemical staining of 1st trimester chorionic villus syncytiotrophoblast with mAb PSG.11 (C). Similar staining was observed with mAb PSG.05 (data not shown). Scale bar = 50 μm.
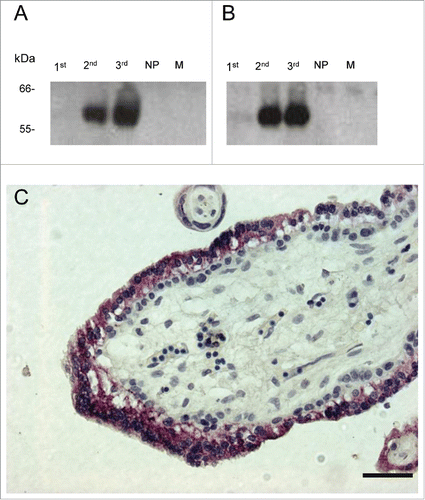
Figure 1. Western blot of 1st, 2nd and 3rd trimester maternal pregnant sera, non-pregnant female serum (NP), and male serum (M), probed with mAb PSG.05 (A) and mAb PSG.11 (B). Immunohistochemical staining of 1st trimester chorionic villus syncytiotrophoblast with mAb PSG.11 (C). Similar staining was observed with mAb PSG.05 (data not shown). Scale bar = 50 μm.

Figure 2. FACS analysis using mAb PSG.05, mAb PSG.11 and rabbit anti-CEA pAb positive control, of Hela cell lines stably expressing CEACAMs (CC1, CC3, CC5, CC6, CC7, CC8) (A). Western blots of Hela, Hela-CC1 and Hela-CC5 cell lysates, and purified recombinant PSG1, probed with rabbit anti-CEA polyclonal, mAb PSG.05, mAb PSG.11, and anti-Actin mAb as loading control for cell lysates (B). Western blots of supernatants from Freestyle293 cells 72 hrs post-transfection with pTT3-PSG1 expression vectors lacking either the N or A1 domain and probed with mAb PSG.05, mAb PSG.11, and an anti-His-Tag polyclonal as positive control. A schematic of human PSG1 wildtype and deletion mutant protein domain structures are shown (C). Western blots of supernatants from Freestyle293 cells 72 hrs post-transfection with pTT3-PSG constructs (PSG1-9, 11) probed with mAb PSG.05, mAb PSG.11, and an anti-His-Tag pAb as positive control (D). Phylogenetic tree of human PSG amino acid sequences. Phylogenetic trees (Neighbor-joined pairwise comparison phylogenetic trees) were constructed using the MEGA4.0 software program (http://www.megasoftware.net/). Data were bootstrapped 1000 times and all major branches yielded values of 95–100%. The scale bars represent 0.5 nucleotide substitutions per site (E).
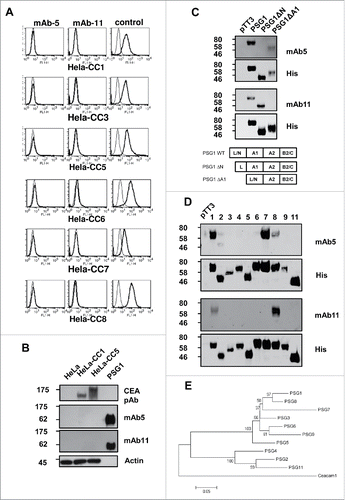
Figure 2. FACS analysis using mAb PSG.05, mAb PSG.11 and rabbit anti-CEA pAb positive control, of Hela cell lines stably expressing CEACAMs (CC1, CC3, CC5, CC6, CC7, CC8) (A). Western blots of Hela, Hela-CC1 and Hela-CC5 cell lysates, and purified recombinant PSG1, probed with rabbit anti-CEA polyclonal, mAb PSG.05, mAb PSG.11, and anti-Actin mAb as loading control for cell lysates (B). Western blots of supernatants from Freestyle293 cells 72 hrs post-transfection with pTT3-PSG1 expression vectors lacking either the N or A1 domain and probed with mAb PSG.05, mAb PSG.11, and an anti-His-Tag polyclonal as positive control. A schematic of human PSG1 wildtype and deletion mutant protein domain structures are shown (C). Western blots of supernatants from Freestyle293 cells 72 hrs post-transfection with pTT3-PSG constructs (PSG1-9, 11) probed with mAb PSG.05, mAb PSG.11, and an anti-His-Tag pAb as positive control (D). Phylogenetic tree of human PSG amino acid sequences. Phylogenetic trees (Neighbor-joined pairwise comparison phylogenetic trees) were constructed using the MEGA4.0 software program (http://www.megasoftware.net/). Data were bootstrapped 1000 times and all major branches yielded values of 95–100%. The scale bars represent 0.5 nucleotide substitutions per site (E).

Figure 3. Immunostaining of PSG (brown) using mAb PSG.11 in normal colon (A), colon adenocarcinoma of increasing stage (B–E), normal oesophagus (F), oesophageal squamous cell carcinoma (G) and metastatic oesophageal carcinoma (H). PSG staining decreases with increasing Dukes' stage (B, Dukes' A; C, Dukes' B; D, Dukes' C; and E, Dukes' D) and on progression from oesophageal squamous cell carcinoma (G) to metastatic oesophageal carcinoma (H). No staining observed in goat serum control (I). All sections were counterstained with haematoxylin (blue). Scale bars = 200 μm (F) and 100 μm (A-E, G-I).
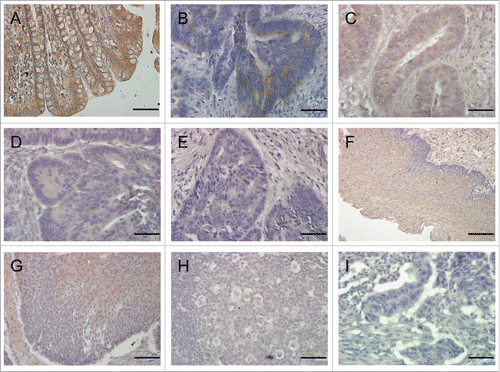
Figure 3. Immunostaining of PSG (brown) using mAb PSG.11 in normal colon (A), colon adenocarcinoma of increasing stage (B–E), normal oesophagus (F), oesophageal squamous cell carcinoma (G) and metastatic oesophageal carcinoma (H). PSG staining decreases with increasing Dukes' stage (B, Dukes' A; C, Dukes' B; D, Dukes' C; and E, Dukes' D) and on progression from oesophageal squamous cell carcinoma (G) to metastatic oesophageal carcinoma (H). No staining observed in goat serum control (I). All sections were counterstained with haematoxylin (blue). Scale bars = 200 μm (F) and 100 μm (A-E, G-I).

Table 1. PSG staining in colonic adenocarcinomasa

Table 2. PSG staining in oesophageal squamous carcinomasa

Figure 4. qRT-PCR analysis of PSG expression in selected human (A) and mouse (B) tissues. Pooled samples of human brain (n=5), oesophagus (n=39), colon (3) and placenta (n=10) were analyzed in duplicate and the experiment was repeated once. For each tissue the 4 data points were combined, normalized to GAPDH, and expressed ± SEM (A). Similarly, tissues from 2 C57BL/6 mice were analyzed in duplicate and the experiment was repeated once. Data were combined, normalized to Hprt, and expressed ± SEM (B). Note logarithmic scale in A & B.
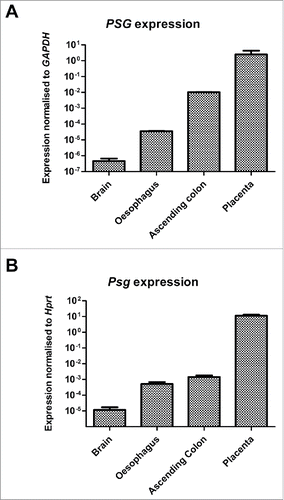
Figure 4. qRT-PCR analysis of PSG expression in selected human (A) and mouse (B) tissues. Pooled samples of human brain (n=5), oesophagus (n=39), colon (3) and placenta (n=10) were analyzed in duplicate and the experiment was repeated once. For each tissue the 4 data points were combined, normalized to GAPDH, and expressed ± SEM (A). Similarly, tissues from 2 C57BL/6 mice were analyzed in duplicate and the experiment was repeated once. Data were combined, normalized to Hprt, and expressed ± SEM (B). Note logarithmic scale in A & B.

Reprints and Corporate Permissions

Please note: Selecting permissions does not provide access to the full text of the article, please see our help page How do I view content?

To request a reprint or corporate permissions for this article, please click on the relevant link below:

Academic Permissions

Please note: Selecting permissions does not provide access to the full text of the article, please see our help page How do I view content?

Obtain permissions instantly via Rightslink by clicking on the button below:

If you are unable to obtain permissions via Rightslink, please complete and submit this Permissions form. For more information, please visit our Permissions help page.