
Figures & data
Figure 1. Secukinumab exhibits low levels of T-cell responses in a low number of donors. Scatter plot showing the proliferation stimulation index (SI) data (A) and interleukin (IL)-2 enzyme-linked immunospot (ELISpot) SI data (B) from 50 donors incubated with the 6 test samples and humanized A33. Horizontal black lines represent mean values and red-dashed line indicates statistically significant SI ≥1 .9. Summary of T-cell proliferation SI and IL-2 ELISpot SI data for all values where SI ≥1 .9 and P<0.05 (C).
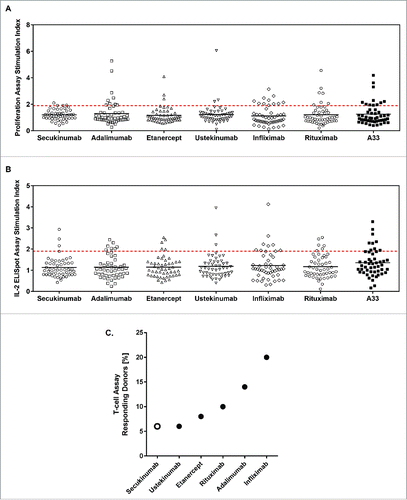
Figure 2. Consistent cluster maps were generated across secukinumab preparations. Major histocompatibility complex–associated peptide proteomics cluster map of human leukocyte antigen-DR–associated peptides produced by 1.5 × 10⁶ dendritic cells from 9 different donors exposed to 3 different secukinumab preparations. Clusters are indicated as black boxes, Complementarity-determining regions are indicated as shaded areas along the sequence of constant domains in heavy chain (CH; left) and light chain (CL; right) above each monoclonal antibody. H, hinge region.
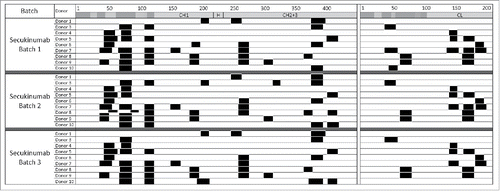
Figure 3. Cluster maps vary across different therapeutic antibodies. Major histocompatibility complex–associated peptide proteomics cluster map of human leukocyte antigen-DR–associated peptides produced by 1.5 × 10⁶ dendritic cells from 10 different donors exposed separately to 5 different therapeutic antibodies is shown. Clusters are indicated as black boxes, Complementarity-determining regions are indicated as shaded areas along the sequence of heavy chain (CH; left) and light chain (CL; right) above each monoclonal antibody. H, hinge region.
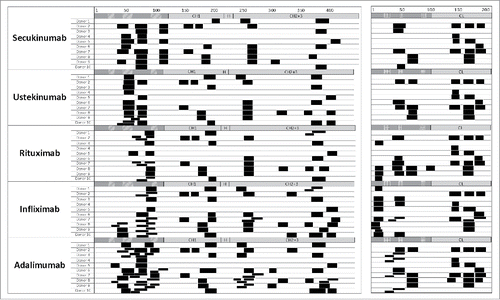
Figure 4. Secukinumab contains low numbers of different and total clusters. For comparison of the 3 independent sets (indicated by different symbols) of 10 donors each, different and total clusters for each biotherapeutic were quantified and normalized to adalimumab (100%) as an arbitrary reference. Average normalized cluster responses (C) were obtained from the normalized values of different (A) and total (B) clusters, averaging both values. The horizontal line indicates the mean of the 3 individual values. MAPPs, major histocompatibility complex–associated peptide proteomics.
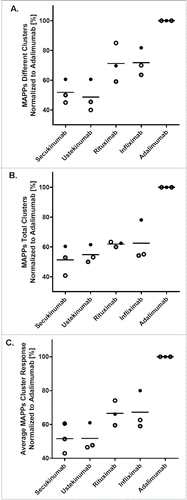
Figure 5. Consistent results from major histocompatibility complex–associated peptide proteomics (MAPPs) and T-cell assays. T-cell assay responses for each biotherapeutic from a total of 50 donors were plotted vs MAPPs average normalized cluster responses from a total of 30 donors.
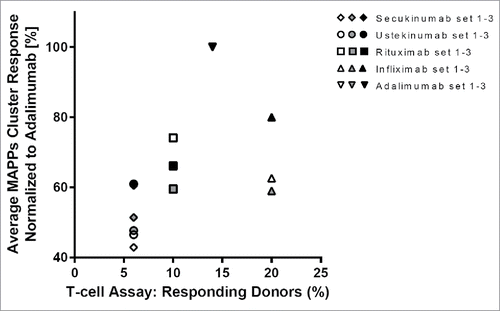
Table 1. Reported Frequency of Anti-Drug Antibodies in Clinical Trials of Selected Biotherapeutics.