6,613
Views
41
CrossRef citations to date
0
Altmetric
Reports

Novel anti-Sialyl-Tn monoclonal antibodies and antibody-drug conjugates demonstrate tumor specificity and anti-tumor activity

, , , , , , , , & show all
Pages 615-627 | Received 16 Dec 2016, Accepted 30 Jan 2017, Published online: 10 Mar 2017

Figures & data

Figure 1. Binding groups determined for anti-STn antibodies. mAbs were grouped based on their binding specificities toward O-glycans. Group 1: mAbs bind STn only (Neu5Acα2,6GalNAcαO). Group 2: mAbs bind to Neu5Acα2,6Gal(NAc)αO. Group 3: mAbs bind to Neu5Acα2,6Gal(NAc)αO and Neu5Acα2,6Gal(NAc)β1,4Glc(NAc)βO. Group 4: mAbs bind to STn and Tn (GalNAcαO). All mAbs also bind the corresponding 9-O-acetylated and Neu5Gc O-glycans. The red shaded circles in the figure and non-greyed out glycans in the table represent the detected epitope for each group.
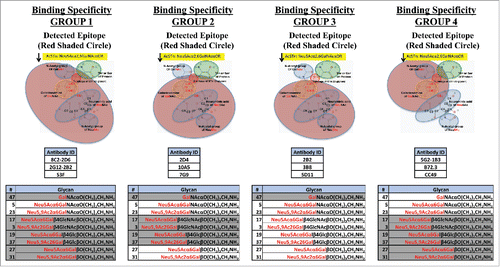
Figure 1. Binding groups determined for anti-STn antibodies. mAbs were grouped based on their binding specificities toward O-glycans. Group 1: mAbs bind STn only (Neu5Acα2,6GalNAcαO). Group 2: mAbs bind to Neu5Acα2,6Gal(NAc)αO. Group 3: mAbs bind to Neu5Acα2,6Gal(NAc)αO and Neu5Acα2,6Gal(NAc)β1,4Glc(NAc)βO. Group 4: mAbs bind to STn and Tn (GalNAcαO). All mAbs also bind the corresponding 9-O-acetylated and Neu5Gc O-glycans. The red shaded circles in the figure and non-greyed out glycans in the table represent the detected epitope for each group.

Figure 2. Representative binding profiles of anti-STn antibodies on the glycan array. Anti-STn commercial antibodies were purchased from vendors (B72.3 Thermo Scientific; CC49 and 3H1951, Santa Cruz Biotechnology; STn219 Abcam). All antibodies were tested using 1 μg/mL concentration. Commercial antibodies recognize multiple STn-related oligosaccharides including the Tn antigen (GalNAc).
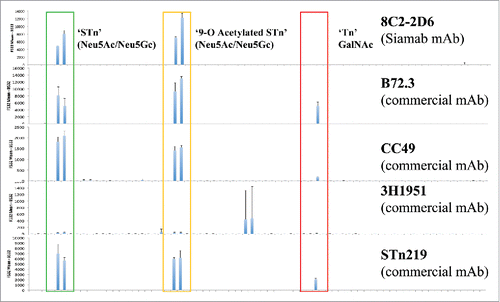
Figure 2. Representative binding profiles of anti-STn antibodies on the glycan array. Anti-STn commercial antibodies were purchased from vendors (B72.3 Thermo Scientific; CC49 and 3H1951, Santa Cruz Biotechnology; STn219 Abcam). All antibodies were tested using 1 μg/mL concentration. Commercial antibodies recognize multiple STn-related oligosaccharides including the Tn antigen (GalNAc).

Table 1. Anti-STn mAb binding results summary.

Figure 3. Immunization resulted in STn specific antibodies as seen in sera and purified hybridoma supernatants. Immune response and antibody evolution from a single animal demonstrated significant and specific STn binding. The antibody binds to all 4 variants of STn included on the array (Neu5Ac/Gc and 9-O acetylated forms). Antibody generation was monitored in serum after immunization (Day 35, 49 and 63) using the glycan array. STn-specific antibodies were observed starting on Day 63, no significant binding was observed to non-STn glycans. This mouse was used to generate hybridomas and clone 2G12–2B2 was selected for STn specificity. Purified antibodies from this hybridoma supernatant demonstrated significant and specific STn binding on the glycan array.
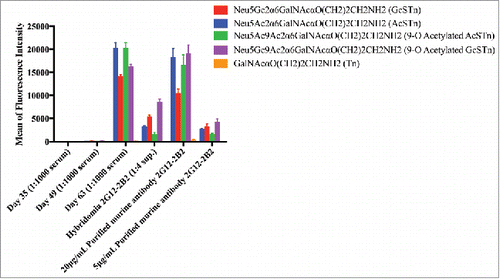
Figure 3. Immunization resulted in STn specific antibodies as seen in sera and purified hybridoma supernatants. Immune response and antibody evolution from a single animal demonstrated significant and specific STn binding. The antibody binds to all 4 variants of STn included on the array (Neu5Ac/Gc and 9-O acetylated forms). Antibody generation was monitored in serum after immunization (Day 35, 49 and 63) using the glycan array. STn-specific antibodies were observed starting on Day 63, no significant binding was observed to non-STn glycans. This mouse was used to generate hybridomas and clone 2G12–2B2 was selected for STn specificity. Purified antibodies from this hybridoma supernatant demonstrated significant and specific STn binding on the glycan array.

Table 2. Binding specificity of antibody panel on human TMA.

Figure 4. Binding specificity of 2G12–2B2 on human TMAs. (A) Normal (non-neoplastic) lung: There was lumen membrane staining of rare alveolar lining cells (arrowheads). Image is from a region with more frequent staining. Bar = 40 μm. (B) Lung squamous cell carcinoma: Membrane staining of neoplastic epithelial cells (arrowheads). Asterisks indicates mononuclear inflammatory cell infiltrate around neoplastic cell infiltrate. Bar = 100 µm. (C) Normal (non-neoplastic) pancreas: There was no staining of any tissue elements. Arrows = islet of Langerhans. Arrowhead = Pancreatic ductule. Bar = 100 µm. (D) Pancreatic ductal adenocarcinoma: Moderate to intense staining of neoplastic cells infiltrating into adjacent stroma. Bar = 50 µm. (E) Normal (non-neoplastic) colon: Cytoplasmic staining of goblet cells (arrowheads). Cytoplasmic +/− membrane staining of scattered endothelial cells. Bar = 100 μm. (F) Ascending colon adenocarcinoma, moderately differentiated: Frequent membrane and staining of neoplastic epithelial cells (arrowheads). Cytoplasmic staining also present. Bar = 40 μm.
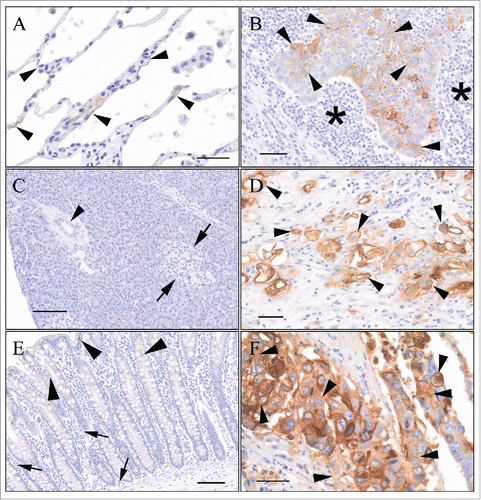
Figure 4. Binding specificity of 2G12–2B2 on human TMAs. (A) Normal (non-neoplastic) lung: There was lumen membrane staining of rare alveolar lining cells (arrowheads). Image is from a region with more frequent staining. Bar = 40 μm. (B) Lung squamous cell carcinoma: Membrane staining of neoplastic epithelial cells (arrowheads). Asterisks indicates mononuclear inflammatory cell infiltrate around neoplastic cell infiltrate. Bar = 100 µm. (C) Normal (non-neoplastic) pancreas: There was no staining of any tissue elements. Arrows = islet of Langerhans. Arrowhead = Pancreatic ductule. Bar = 100 µm. (D) Pancreatic ductal adenocarcinoma: Moderate to intense staining of neoplastic cells infiltrating into adjacent stroma. Bar = 50 µm. (E) Normal (non-neoplastic) colon: Cytoplasmic staining of goblet cells (arrowheads). Cytoplasmic +/− membrane staining of scattered endothelial cells. Bar = 100 μm. (F) Ascending colon adenocarcinoma, moderately differentiated: Frequent membrane and staining of neoplastic epithelial cells (arrowheads). Cytoplasmic staining also present. Bar = 40 μm.

Figure 5. Internalization of STn antibodies in STn± MDA-MB-231 cells. (A) Internalization of labeled anti-STn mAbs were tested using STn-expressing (filled bars) and non-expressing (empty bars) human breast cancer cells. Eight anti-STn mAbs and an isotype control were conjugated to a pH reactive dye that becomes fluorescent upon internalization into lower pH organelles like lysosomes. Six of eight mAbs showed significant internalization into STn-expressing cells as compared with non-expressing cells (*P < 0.05, **P < 0.01, N = 6). 5G2–1B3 was also conjugated, but poor recovery after conjugation did not allow for comparison to other tested antibodies. The isotype control MOPC173 antibody did not significantly internalize into either expressing or non-expressing cells. Error bars denote standard error. P-values were determined by one-sided student-t test with unequal variance. (B) Representative images for antibody Alexa 488-labeled S3F internalization. Cells were incubated with 5 μg/mL S3F-Alexa 488 for 1 hour at 4°C, then incubated at various times at 37°C (0, 15, 30, 60 minutes). Cells were treated with 5-minute acid wash (150 mM NaCl/HCl pH 2.5) to remove surface bound antibodies. No surface staining nor internalization were seen in MDA-MB-231 STn- cells. Internalization of S3F was seen in STn+ cells as early as 15 minutes and was strongly evident at 60 minutes.
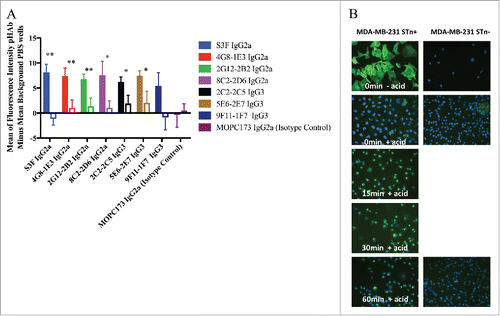
Figure 5. Internalization of STn antibodies in STn± MDA-MB-231 cells. (A) Internalization of labeled anti-STn mAbs were tested using STn-expressing (filled bars) and non-expressing (empty bars) human breast cancer cells. Eight anti-STn mAbs and an isotype control were conjugated to a pH reactive dye that becomes fluorescent upon internalization into lower pH organelles like lysosomes. Six of eight mAbs showed significant internalization into STn-expressing cells as compared with non-expressing cells (*P < 0.05, **P < 0.01, N = 6). 5G2–1B3 was also conjugated, but poor recovery after conjugation did not allow for comparison to other tested antibodies. The isotype control MOPC173 antibody did not significantly internalize into either expressing or non-expressing cells. Error bars denote standard error. P-values were determined by one-sided student-t test with unequal variance. (B) Representative images for antibody Alexa 488-labeled S3F internalization. Cells were incubated with 5 μg/mL S3F-Alexa 488 for 1 hour at 4°C, then incubated at various times at 37°C (0, 15, 30, 60 minutes). Cells were treated with 5-minute acid wash (150 mM NaCl/HCl pH 2.5) to remove surface bound antibodies. No surface staining nor internalization were seen in MDA-MB-231 STn- cells. Internalization of S3F was seen in STn+ cells as early as 15 minutes and was strongly evident at 60 minutes.

Figure 6. Cell viability assay with mouse anti-STn ADCs. Anti-STn ADC antibodies kill STn+ MDA-MB-231 cells (single digit nanomolar IC50s), while naked anti-STn antibodies do not (Fig. S1).
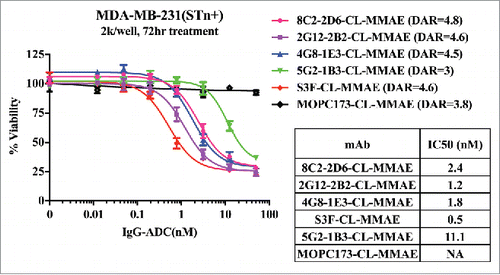
Figure 6. Cell viability assay with mouse anti-STn ADCs. Anti-STn ADC antibodies kill STn+ MDA-MB-231 cells (single digit nanomolar IC50s), while naked anti-STn antibodies do not (Fig. S1).

Figure 7. Effect of anti-STn ADCs on tumor growth in subcutaneous human breast cancer xenograft model. An ICR SCID subcutaneous xenograft mouse model was used with MDA-MB-231 STn+ transfected human breast cancer cells. The dosing schedule was Q7Dx3 (one 2.5 mg/kg dose a week for 3 weeks, blue arrows). When tumors reached end point volume (≥ 1000 mm3) the group was terminated. N = 10 mice for all groups. Unconjugated antibody control was an equal mixture of 2.5 mg/kg unconjugated 2G12–2B2 and 4G8–1E3.
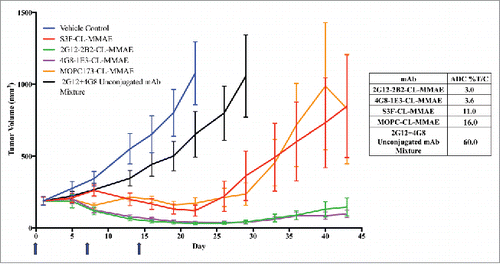
Figure 7. Effect of anti-STn ADCs on tumor growth in subcutaneous human breast cancer xenograft model. An ICR SCID subcutaneous xenograft mouse model was used with MDA-MB-231 STn+ transfected human breast cancer cells. The dosing schedule was Q7Dx3 (one 2.5 mg/kg dose a week for 3 weeks, blue arrows). When tumors reached end point volume (≥ 1000 mm3) the group was terminated. N = 10 mice for all groups. Unconjugated antibody control was an equal mixture of 2.5 mg/kg unconjugated 2G12–2B2 and 4G8–1E3.

Table 3. STn expression in various cancer cell lines.

Figure 8. Proof-of-concept human colorectal cancer naturally expressing STn model using anti-STn S3F and 2 different ADC formats. An athymic nude mouse subcutaneous xenograft mouse model was used with COLO205 human colorectal cancer cells. Animals were dosed Q7Dx3 at 5 mg/kg (one 5 mg/kg dose a week for 3 weeks, blue arrows). Antibody alone with no toxin (red), S3F-CL–MMAE (MC-vc-PAB-MMAE, green) and S3F-NC-MMAF (NC-MMAF, purple), all were compared with vehicle alone (blue).
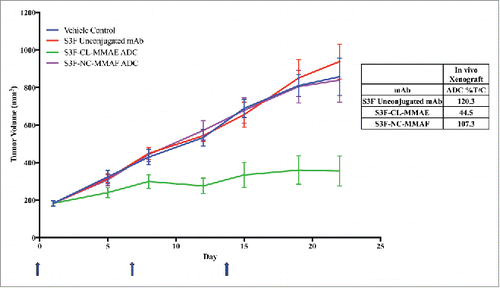
Figure 8. Proof-of-concept human colorectal cancer naturally expressing STn model using anti-STn S3F and 2 different ADC formats. An athymic nude mouse subcutaneous xenograft mouse model was used with COLO205 human colorectal cancer cells. Animals were dosed Q7Dx3 at 5 mg/kg (one 5 mg/kg dose a week for 3 weeks, blue arrows). Antibody alone with no toxin (red), S3F-CL–MMAE (MC-vc-PAB-MMAE, green) and S3F-NC-MMAF (NC-MMAF, purple), all were compared with vehicle alone (blue).
Supplemental material

Supplemental_Data.zip

Download Zip (213.4 KB)