1,416
Views
10
CrossRef citations to date
0
Altmetric
Report

Single amino acid substitution in LC-CDR1 induces Russell body phenotype that attenuates cellular protein synthesis through eIF2α phosphorylation and thereby downregulates IgG secretion despite operational secretory pathway traffic

ORCID Icon, , ORCID Icon, , ORCID Icon & ORCID Icon
Pages 854-873 | Received 21 Feb 2017, Accepted 30 Mar 2017, Published online: 12 May 2017

Figures & data

Figure 1. Effects of single amino acid substitution on the secretion of whole IgG and LC subunit. (A) Homology models showing the variable fragment of the parental (left) and the N35W variant (right) mAbs. Surface is colored according to the Eisenberg hydrophobicity scaleCitation47 with red indicating high hydrophobicity and white indicating low hydrophobicity. The N35W variant has more exposed hydrophobic characteristics in the CDRs than does the parental mAb. LC-CDR1 (L1) and HC-CDR3 (H3) are long and are predicted to be highly dynamic in solution. The Trp residue of the N35W variant is likely to be solvent-exposed, presenting a hydrophobic patch that could render the antibody prone to non-specific interactions. (B, C, D) Cell culture media and whole cell lysate samples were prepared on day-7 post transfection and were subjected to SDS-PAGE followed by Western blot using rabbit anti-human IgG (H+L) polyclonal antibody. Samples in lanes 1–2 and lanes 3–5 were analyzed in the non-contiguous lanes of a single gel, but the intervening lanes were digitally removed to create the figures B–D. (B) A sample volume corresponding to the 5 μl of harvested cell culture medium was loaded per lane and analyzed under reducing conditions. Expected band for heavy chain (HC) and light chain (LC) subunits are marked by arrowhead. Determined secretion titers for this mAb production run are shown in lanes 1 and 2. (C) Whole cell lysates equivalent to 12,000–12,500 cells were loaded per lane under reducing conditions. Expected band for HC and LC subunits are marked by arrowhead. A faint band marked by asterisk in lane 5 is apparently a LC-N35W dimer species that was resistant to SDS treatment or disulfide reduction. Anti-GAPDH blot is shown at the bottom as a loading reference. (D) Cell culture media were analyzed under non-reducing conditions. LCs are secreted as a mixture of monomers (mono.) and covalent dimers (di.). Trimer and tetramer species are faintly detectable. (E) On day-2 post transfection, transfected cells were resuspended in fresh growth media with or without 15 μg/ml BFA and maintained in suspension format until day-3 when cell culture media and cell pellets were harvested and analyzed under reducing conditions. The amount of IgGs secreted to the culture medium during the 24 hr period is shown in the left panel. The amount of IgGs detected in the cell lysates is shown in the right panel. Anti-GAPDH blot is shown as a loading reference for cell lysate samples. (F, G) Cell viability and viable cell density were monitored daily by using automated cell counters. Data compiled from 6 independent experiments for the parental IgG and 4 independent runs for the N35W variant were used to calculate the average and standard deviation.
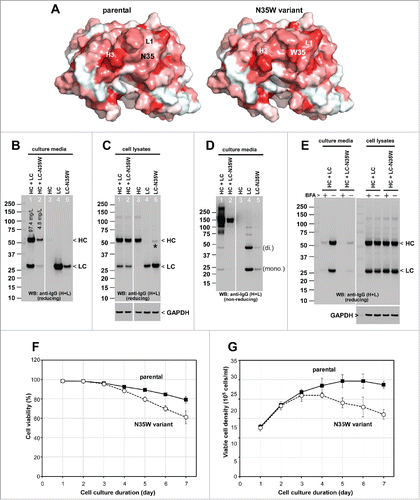
Figure 1. Effects of single amino acid substitution on the secretion of whole IgG and LC subunit. (A) Homology models showing the variable fragment of the parental (left) and the N35W variant (right) mAbs. Surface is colored according to the Eisenberg hydrophobicity scaleCitation47 with red indicating high hydrophobicity and white indicating low hydrophobicity. The N35W variant has more exposed hydrophobic characteristics in the CDRs than does the parental mAb. LC-CDR1 (L1) and HC-CDR3 (H3) are long and are predicted to be highly dynamic in solution. The Trp residue of the N35W variant is likely to be solvent-exposed, presenting a hydrophobic patch that could render the antibody prone to non-specific interactions. (B, C, D) Cell culture media and whole cell lysate samples were prepared on day-7 post transfection and were subjected to SDS-PAGE followed by Western blot using rabbit anti-human IgG (H+L) polyclonal antibody. Samples in lanes 1–2 and lanes 3–5 were analyzed in the non-contiguous lanes of a single gel, but the intervening lanes were digitally removed to create the figures B–D. (B) A sample volume corresponding to the 5 μl of harvested cell culture medium was loaded per lane and analyzed under reducing conditions. Expected band for heavy chain (HC) and light chain (LC) subunits are marked by arrowhead. Determined secretion titers for this mAb production run are shown in lanes 1 and 2. (C) Whole cell lysates equivalent to 12,000–12,500 cells were loaded per lane under reducing conditions. Expected band for HC and LC subunits are marked by arrowhead. A faint band marked by asterisk in lane 5 is apparently a LC-N35W dimer species that was resistant to SDS treatment or disulfide reduction. Anti-GAPDH blot is shown at the bottom as a loading reference. (D) Cell culture media were analyzed under non-reducing conditions. LCs are secreted as a mixture of monomers (mono.) and covalent dimers (di.). Trimer and tetramer species are faintly detectable. (E) On day-2 post transfection, transfected cells were resuspended in fresh growth media with or without 15 μg/ml BFA and maintained in suspension format until day-3 when cell culture media and cell pellets were harvested and analyzed under reducing conditions. The amount of IgGs secreted to the culture medium during the 24 hr period is shown in the left panel. The amount of IgGs detected in the cell lysates is shown in the right panel. Anti-GAPDH blot is shown as a loading reference for cell lysate samples. (F, G) Cell viability and viable cell density were monitored daily by using automated cell counters. Data compiled from 6 independent experiments for the parental IgG and 4 independent runs for the N35W variant were used to calculate the average and standard deviation.

Figure 2. Single amino acid substitution leads to a marked increase in Russell body phenotype occurrence during immunoglobulin biosynthesis. Fluorescent micrographs of HEK293 cells expressing the parental IgG or its N35W variant. On day-2 post transfection, HEK293 cells were resuspended in fresh cell culture media with or without 15 μg/ml BFA, then immediately seeded onto poly-lysine coated glass coverslips and statically cultured for 24 hr. On day-3, cells were fixed, permeabilized, and immuno-stained. Co-staining was performed by using FITC-conjugated anti-gamma chain and Texas Red-conjugated anti-kappa chain polyclonal antibodies. Green and red image fields were superimposed to create ‘merge’ views. DIC and ‘merge’ were superimposed to generate ‘overlay’ views. (A) Subcellular localization of gamma-chain and kappa-chain was visualized under steady-state normal cell growth conditions. Two representative image fields for the parental IgG expressing cells are shown in the first 2 rows. Two representative image fields for N35W variant IgG expressing cells are shown in rows 3 and 4. (B) Gamma- and kappa-chains of the parental IgG (first 2 rows) and N35W variant IgG (rows 3 to 5) were visualized after 24 hr BFA treatment. The RB phenotype frequency for each mAb under steady-state or after BFA treatment is stated in the text. Unlabeled scale bar represents 10 μm.
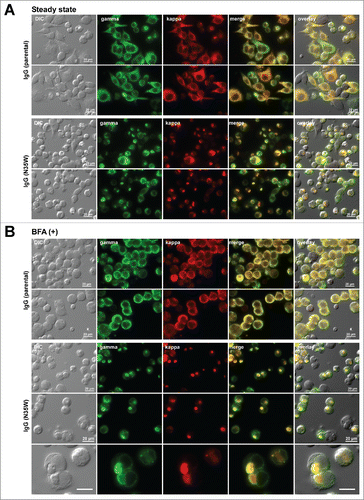
Figure 2. Single amino acid substitution leads to a marked increase in Russell body phenotype occurrence during immunoglobulin biosynthesis. Fluorescent micrographs of HEK293 cells expressing the parental IgG or its N35W variant. On day-2 post transfection, HEK293 cells were resuspended in fresh cell culture media with or without 15 μg/ml BFA, then immediately seeded onto poly-lysine coated glass coverslips and statically cultured for 24 hr. On day-3, cells were fixed, permeabilized, and immuno-stained. Co-staining was performed by using FITC-conjugated anti-gamma chain and Texas Red-conjugated anti-kappa chain polyclonal antibodies. Green and red image fields were superimposed to create ‘merge’ views. DIC and ‘merge’ were superimposed to generate ‘overlay’ views. (A) Subcellular localization of gamma-chain and kappa-chain was visualized under steady-state normal cell growth conditions. Two representative image fields for the parental IgG expressing cells are shown in the first 2 rows. Two representative image fields for N35W variant IgG expressing cells are shown in rows 3 and 4. (B) Gamma- and kappa-chains of the parental IgG (first 2 rows) and N35W variant IgG (rows 3 to 5) were visualized after 24 hr BFA treatment. The RB phenotype frequency for each mAb under steady-state or after BFA treatment is stated in the text. Unlabeled scale bar represents 10 μm.

Figure 3. Russell body-inducing propensities of individual subunit chains. Fluorescent micrographs of HEK293 cells transfected with the (A) HC construct alone, (B) LC construct alone, or (C) N35W variant LC construct alone, under steady-state cell growth conditions. On day-2 post transfection, suspension cultured cells were seeded onto poly-lysine coated glass coverslips and statically cultured for 24 hr. On day-3, cells were fixed, permeabilized, and co-stained with anti-CD147 and anti-gamma chain (A). In panels B and C, cells were co-stained with anti-CD147 and anti-kappa chain. Endogenous CD147 was stained to highlight cell shapes. Green and red image fields were superimposed to create ‘merge’ views. DIC and ‘red’ were superimposed to generate ‘overlay’ views.
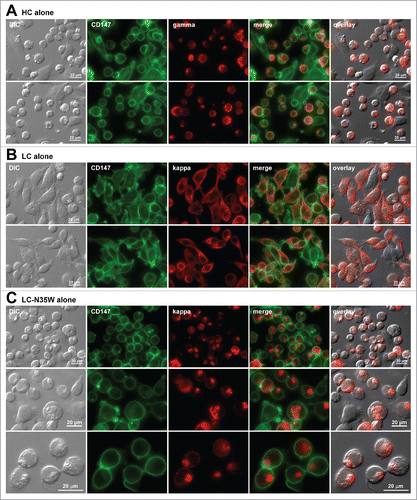
Figure 3. Russell body-inducing propensities of individual subunit chains. Fluorescent micrographs of HEK293 cells transfected with the (A) HC construct alone, (B) LC construct alone, or (C) N35W variant LC construct alone, under steady-state cell growth conditions. On day-2 post transfection, suspension cultured cells were seeded onto poly-lysine coated glass coverslips and statically cultured for 24 hr. On day-3, cells were fixed, permeabilized, and co-stained with anti-CD147 and anti-gamma chain (A). In panels B and C, cells were co-stained with anti-CD147 and anti-kappa chain. Endogenous CD147 was stained to highlight cell shapes. Green and red image fields were superimposed to create ‘merge’ views. DIC and ‘red’ were superimposed to generate ‘overlay’ views.

Figure 4. Comparison of the parental and N35W variant mAb properties by biochemical and cell-based assays. (A) After purification, the parental IgG and its N35W variant were resolved in SDS-PAGE gels side by side under reducing (lanes 1–2) and non-reducing (lanes 3–4) conditions, then stained with Coomassie blue dye. Protein loading was 10 μg per lane. Protein bands corresponding to the HC subunit, LC subunit, and whole IgG are marked by arrowhead. (B) Purified IgGs were formulated in PBS and analyzed by differential scanning calorimetry. Heat capacity (Cp) is plotted on the y-axis as a function of heat influx on the x-axis. Three discernible peaks are labeled with the domain names corresponding to the respective unfolding events that take place at different temperature range. (C) Size-exclusion chromatograms of purified parental IgG (top) and its N35W variant (bottom) using Superdex G200 column. Protein loading was 10 μg each. The running buffer was PBS at a flow rate of 0.7 ml/min. The elution profile was monitored by UV light at 215 nm. AU, arbitrary unit. Paper-printed chromatograms were scanned and digitally reproduced to create this figure. Retention time is labeled for each elution peak. (D) Flow cytometric binding analysis of the parental and variant mAbs to human CB1 expressed on the surface of stable CHO cell line. After harvesting the adherently cultured CHO cells non-enzymatically, 200,000 cells were stained at testing antibody concentrations of 0.2, 1, and 5 μg/ml. A representative result obtained at 1 μg/ml antibody staining condition is shown. Signal intensity based on the geometric mean values was ∼2-fold higher for N35W variant mAb than for the parental mAb. (E) Results of cell-based assay measuring cellular cAMP levels after CB1 activation in the presence of the parental or N35W variant mAbs. CB1 activation leads to a decrease in intracellular cAMP. If CB1 activation is blocked by antagonistic mAbs, intracellular cAMP level would be restored. In this assay system, the variant mAb showed ∼4-fold higher antagonistic activity than the parental mAb. Four-fold difference in antagonistic activity was reproducible although the IC50 values shifted slightly on different testing occasions. This graph was generated by using a data set obtained in one such representative experiment. Error bar represents ‘standard error of mean’.
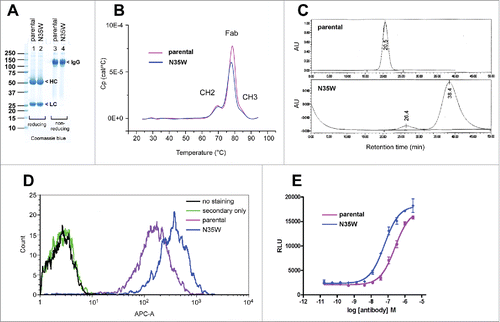
Figure 4. Comparison of the parental and N35W variant mAb properties by biochemical and cell-based assays. (A) After purification, the parental IgG and its N35W variant were resolved in SDS-PAGE gels side by side under reducing (lanes 1–2) and non-reducing (lanes 3–4) conditions, then stained with Coomassie blue dye. Protein loading was 10 μg per lane. Protein bands corresponding to the HC subunit, LC subunit, and whole IgG are marked by arrowhead. (B) Purified IgGs were formulated in PBS and analyzed by differential scanning calorimetry. Heat capacity (Cp) is plotted on the y-axis as a function of heat influx on the x-axis. Three discernible peaks are labeled with the domain names corresponding to the respective unfolding events that take place at different temperature range. (C) Size-exclusion chromatograms of purified parental IgG (top) and its N35W variant (bottom) using Superdex G200 column. Protein loading was 10 μg each. The running buffer was PBS at a flow rate of 0.7 ml/min. The elution profile was monitored by UV light at 215 nm. AU, arbitrary unit. Paper-printed chromatograms were scanned and digitally reproduced to create this figure. Retention time is labeled for each elution peak. (D) Flow cytometric binding analysis of the parental and variant mAbs to human CB1 expressed on the surface of stable CHO cell line. After harvesting the adherently cultured CHO cells non-enzymatically, 200,000 cells were stained at testing antibody concentrations of 0.2, 1, and 5 μg/ml. A representative result obtained at 1 μg/ml antibody staining condition is shown. Signal intensity based on the geometric mean values was ∼2-fold higher for N35W variant mAb than for the parental mAb. (E) Results of cell-based assay measuring cellular cAMP levels after CB1 activation in the presence of the parental or N35W variant mAbs. CB1 activation leads to a decrease in intracellular cAMP. If CB1 activation is blocked by antagonistic mAbs, intracellular cAMP level would be restored. In this assay system, the variant mAb showed ∼4-fold higher antagonistic activity than the parental mAb. Four-fold difference in antagonistic activity was reproducible although the IC50 values shifted slightly on different testing occasions. This graph was generated by using a data set obtained in one such representative experiment. Error bar represents ‘standard error of mean’.

Figure 5. Organization of secretory pathway organelles in Russell body-positive cells. Fluorescent micrographs of HEK293 cells transfected with N35W variant LC construct. On day-2 post transfection, suspension cultured cells were seeded onto poly-lysine coated glass coverslips and statically incubated for 24 hr. On day-3, cells were fixed, permeabilized, and co-stained with Texas Red-conjugated anti-kappa chain polyclonal antibody and specific antibodies against various organelle markers. (A, B) ER markers BiP and calnexin. (C) A cis-/medial-Golgi marker giantin. (D) A trans-Golgi marker p230. Green and red image fields were superimposed to create ‘merge’ views. DIC and ‘merge’ were superimposed to generate ‘overlay’ views. In panel C top row, arrowhead points to a normal ribbon-like Golgi morphology in a non-transfected cell. Unlabeled scale bar represents 10 μm.
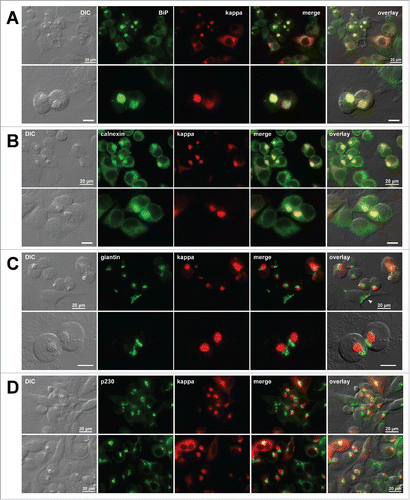
Figure 5. Organization of secretory pathway organelles in Russell body-positive cells. Fluorescent micrographs of HEK293 cells transfected with N35W variant LC construct. On day-2 post transfection, suspension cultured cells were seeded onto poly-lysine coated glass coverslips and statically incubated for 24 hr. On day-3, cells were fixed, permeabilized, and co-stained with Texas Red-conjugated anti-kappa chain polyclonal antibody and specific antibodies against various organelle markers. (A, B) ER markers BiP and calnexin. (C) A cis-/medial-Golgi marker giantin. (D) A trans-Golgi marker p230. Green and red image fields were superimposed to create ‘merge’ views. DIC and ‘merge’ were superimposed to generate ‘overlay’ views. In panel C top row, arrowhead points to a normal ribbon-like Golgi morphology in a non-transfected cell. Unlabeled scale bar represents 10 μm.

Figure 6. Distribution of additional subcellular markers in Russel body-positive cells. Fluorescent micrographs of HEK293 cells transfected with N35W variant LC construct. On day-2 post transfection, suspension cultured cells were seeded onto poly-lysine coated glass coverslips and statically incubated for 24 hr. On day-3, cells were fixed, permeabilized, and co-stained with Texas Red-conjugated anti-kappa chain polyclonal antibody and specific antibodies against various subcellular markers. (A) A recycling endosome marker, transferrin receptor (TfR). The boxed area in the first row is digitally magnified and shown in the second row. (B) A lysosome marker, LAMP1. Arrowhead shown in the second row points to lysosome–RB contact area. (C) An autophagosome marker, LC3. Regardless of the RB phenotype, LC3 is not upregulated under normal cell culture conditions used. (D) Poly-ubiquitinated proteins were stained with anti-ubiquitin monoclonal antibody (clone FK2). (E) A mitochondrial membrane marker, Tom20. (F) A microtubule component β-tubulin. Green and red image fields were superimposed to create ‘merge’ views. DIC and ‘merge’ were superimposed to generate ‘overlay’ views. Unlabeled scale bar represents 10 μm.
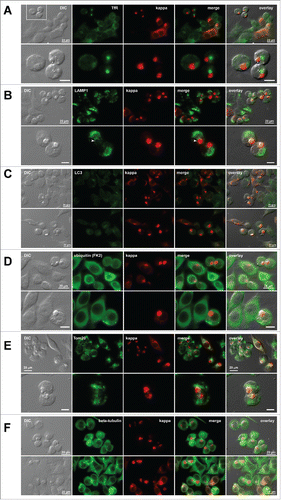
Figure 6. Distribution of additional subcellular markers in Russel body-positive cells. Fluorescent micrographs of HEK293 cells transfected with N35W variant LC construct. On day-2 post transfection, suspension cultured cells were seeded onto poly-lysine coated glass coverslips and statically incubated for 24 hr. On day-3, cells were fixed, permeabilized, and co-stained with Texas Red-conjugated anti-kappa chain polyclonal antibody and specific antibodies against various subcellular markers. (A) A recycling endosome marker, transferrin receptor (TfR). The boxed area in the first row is digitally magnified and shown in the second row. (B) A lysosome marker, LAMP1. Arrowhead shown in the second row points to lysosome–RB contact area. (C) An autophagosome marker, LC3. Regardless of the RB phenotype, LC3 is not upregulated under normal cell culture conditions used. (D) Poly-ubiquitinated proteins were stained with anti-ubiquitin monoclonal antibody (clone FK2). (E) A mitochondrial membrane marker, Tom20. (F) A microtubule component β-tubulin. Green and red image fields were superimposed to create ‘merge’ views. DIC and ‘merge’ were superimposed to generate ‘overlay’ views. Unlabeled scale bar represents 10 μm.
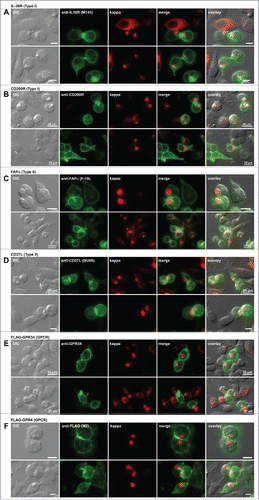
Figure 7. Cell surface trafficking of membrane-anchored proteins in Russell body-positive cells. Fluorescent micrographs of HEK293 cells co-transfected with N35W variant LC construct and one of the expression constructs encoding the following plasma membrane protein. Type I membrane proteins: (A) human IL-36R and (B) human CD200R. Type II membrane proteins: (C) human FAPα and (D) human CD27L. Polytopic membrane proteins: (E) N-terminally FLAG-tagged human GPR34 and (F) N-terminally FLAG-tagged human GPR4. On day-2 post transfection, suspension cultured cells were seeded onto poly-lysine coated glass coverslips and statically incubated for 24 hr. On day-3, cells were fixed, permeabilized, and co-stained with Texas Red-conjugated anti-kappa chain polyclonal antibody and the following antibodies. (A) Mouse anti-human IL-36R monoclonal antibody, clone M145. (B) Mouse anti-human CD200R monoclonal antibody, clone 380525. (C) Mouse anti-human FAPa monoclonal antibody clone F19. (D) Mouse anti-human CD27L monoclonal antibody, clone BU69. (E) Mouse anti-human GPR34 monoclonal antibody, clone 419859. (F) Mouse anti-FLAG monoclonal antibody, clone M2. Green and red image fields were superimposed to create ‘merge’ views. DIC and ‘merge’ were superimposed to generate ‘overlay’ views. Unlabeled scale bar represents 10 μm.

Figure 7. Cell surface trafficking of membrane-anchored proteins in Russell body-positive cells. Fluorescent micrographs of HEK293 cells co-transfected with N35W variant LC construct and one of the expression constructs encoding the following plasma membrane protein. Type I membrane proteins: (A) human IL-36R and (B) human CD200R. Type II membrane proteins: (C) human FAPα and (D) human CD27L. Polytopic membrane proteins: (E) N-terminally FLAG-tagged human GPR34 and (F) N-terminally FLAG-tagged human GPR4. On day-2 post transfection, suspension cultured cells were seeded onto poly-lysine coated glass coverslips and statically incubated for 24 hr. On day-3, cells were fixed, permeabilized, and co-stained with Texas Red-conjugated anti-kappa chain polyclonal antibody and the following antibodies. (A) Mouse anti-human IL-36R monoclonal antibody, clone M145. (B) Mouse anti-human CD200R monoclonal antibody, clone 380525. (C) Mouse anti-human FAPa monoclonal antibody clone F19. (D) Mouse anti-human CD27L monoclonal antibody, clone BU69. (E) Mouse anti-human GPR34 monoclonal antibody, clone 419859. (F) Mouse anti-FLAG monoclonal antibody, clone M2. Green and red image fields were superimposed to create ‘merge’ views. DIC and ‘merge’ were superimposed to generate ‘overlay’ views. Unlabeled scale bar represents 10 μm.

Figure 8. Protein translation is suppressed in Russell body-positive cells. Fluorescent micrographs of HEK293 cells transfected with the following construct(s): (A) LC construct alone; (B) LC-N35W construct alone; (C) HC construct alone; (D) parental IgG; (E) N35W variant IgG. Transfected cells were cultured under steady-state growth conditions and labeled for 30 min using Alexa Fluor 488 Click-iT® Plus OPP reagent to measure actively ongoing protein translation in situ (see Materials and Methods). The click-labeled cells were then immuno-stained with (A, B) Texas Red-conjugated anti-kappa chain, (C) Texas Red-conjugated anti-gamma chain, or (D, E) Alexa Fluor 594-conjugated anti-human IgG (H+L). Green and red image fields were superimposed to create ‘merge’ views. DIC and green or DIC and red images were superimposed to generate ‘overlay’ views.
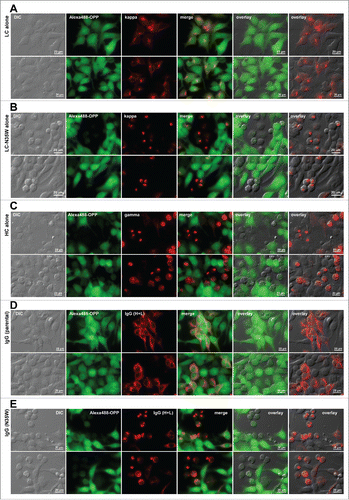
Figure 8. Protein translation is suppressed in Russell body-positive cells. Fluorescent micrographs of HEK293 cells transfected with the following construct(s): (A) LC construct alone; (B) LC-N35W construct alone; (C) HC construct alone; (D) parental IgG; (E) N35W variant IgG. Transfected cells were cultured under steady-state growth conditions and labeled for 30 min using Alexa Fluor 488 Click-iT® Plus OPP reagent to measure actively ongoing protein translation in situ (see Materials and Methods). The click-labeled cells were then immuno-stained with (A, B) Texas Red-conjugated anti-kappa chain, (C) Texas Red-conjugated anti-gamma chain, or (D, E) Alexa Fluor 594-conjugated anti-human IgG (H+L). Green and red image fields were superimposed to create ‘merge’ views. DIC and green or DIC and red images were superimposed to generate ‘overlay’ views.
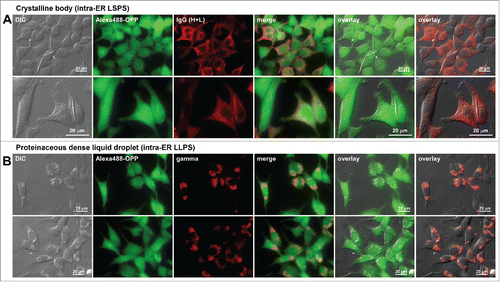
Figure 9. Protein translation is not attenuated in cells showing different classes of immunoglobulin inclusion body phenotype. Fluorescent micrographs of HEK293 cells expressing (A) a human IgG4 clone that induces crystalline body via intra-ER liquid-solid phase separation (LSPS)Citation29 and (B) a scFv-Fc construct that induces morula cell phenotype via intra-ER liquid-liquid phase separation (LLPS).Citation39 Transfected cells were first labeled for 30 min using Alexa Fluor 488 Click-iT® Plus OPP reagent to detect actively ongoing protein translation in situ (see Materials and Methods). The click-labeled cells were then immuno-stained with (A) Alexa Fluor 594-conjugated anti-human IgG (H+L) or (B) Texas Red-conjugated anti-gamma chain polyclonal antibodies. Green and red image fields were superimposed to create ‘merge’ views. DIC and green or DIC and red images were superimposed to generate ‘overlay’ views.

Figure 9. Protein translation is not attenuated in cells showing different classes of immunoglobulin inclusion body phenotype. Fluorescent micrographs of HEK293 cells expressing (A) a human IgG4 clone that induces crystalline body via intra-ER liquid-solid phase separation (LSPS)Citation29 and (B) a scFv-Fc construct that induces morula cell phenotype via intra-ER liquid-liquid phase separation (LLPS).Citation39 Transfected cells were first labeled for 30 min using Alexa Fluor 488 Click-iT® Plus OPP reagent to detect actively ongoing protein translation in situ (see Materials and Methods). The click-labeled cells were then immuno-stained with (A) Alexa Fluor 594-conjugated anti-human IgG (H+L) or (B) Texas Red-conjugated anti-gamma chain polyclonal antibodies. Green and red image fields were superimposed to create ‘merge’ views. DIC and green or DIC and red images were superimposed to generate ‘overlay’ views.

Figure 10. Translation initiation factor eIF2α is phosphorylated in Russell body-positive cells. Fluorescent micrographs of HEK293 cells transfected with the following constructs: (A) HC construct alone; (B) LC construct alone; (C, D) N35W variant LC construct alone. On day-2 post transfection, suspension cultured cells were seeded onto poly-lysine coated glass coverslips and statically incubated for 24 hr. On day-3, cells were fixed, permeabilized, and stained with Texas Red-conjugated anti-kappa chain or Texas Red-conjugated anti-gamma chain polyclonal antibodies. In panels A through C, cells were co-stained with 2 different rabbit anti-phosphorylated eIF2α monoclonal antibodies, clones 119A11 (first row of each panel) or D9G8 (second row of each panel). In panel D, cells were co-stained with 2 rabbit anti-phospho-eIF2α polysera obtained from 2 different sources (see Materials and Methods). Green and red image fields were superimposed to create ‘merge’ views. DIC and ‘merge’ were superimposed to generate ‘overlay’ views.
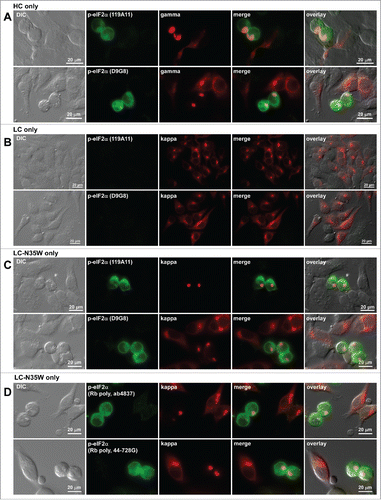
Figure 10. Translation initiation factor eIF2α is phosphorylated in Russell body-positive cells. Fluorescent micrographs of HEK293 cells transfected with the following constructs: (A) HC construct alone; (B) LC construct alone; (C, D) N35W variant LC construct alone. On day-2 post transfection, suspension cultured cells were seeded onto poly-lysine coated glass coverslips and statically incubated for 24 hr. On day-3, cells were fixed, permeabilized, and stained with Texas Red-conjugated anti-kappa chain or Texas Red-conjugated anti-gamma chain polyclonal antibodies. In panels A through C, cells were co-stained with 2 different rabbit anti-phosphorylated eIF2α monoclonal antibodies, clones 119A11 (first row of each panel) or D9G8 (second row of each panel). In panel D, cells were co-stained with 2 rabbit anti-phospho-eIF2α polysera obtained from 2 different sources (see Materials and Methods). Green and red image fields were superimposed to create ‘merge’ views. DIC and ‘merge’ were superimposed to generate ‘overlay’ views.
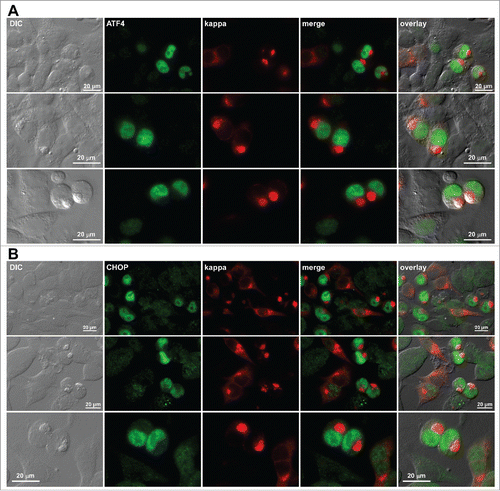
Figure 11. Upregulation and nuclear accumulation of PERK downstream effectors ATF4 and CHOP in Russell body-positive cells. Fluorescent micrographs of HEK293 cells transfected with N35W variant LC construct. On day-2 post transfection, suspension cultured cells were seeded onto poly-lysine coated glass coverslips and statically incubated for 24 hr. On day-3, cells were fixed, permeabilized, and co-stained with Texas Red-conjugated anti-kappa polyclonal antibody and specific antibodies against ATF4 (A) and CHOP (B). Green and red image fields were superimposed to create ‘merge’ views. DIC and ‘merge’ were superimposed to generate ‘overlay’ views.

Figure 11. Upregulation and nuclear accumulation of PERK downstream effectors ATF4 and CHOP in Russell body-positive cells. Fluorescent micrographs of HEK293 cells transfected with N35W variant LC construct. On day-2 post transfection, suspension cultured cells were seeded onto poly-lysine coated glass coverslips and statically incubated for 24 hr. On day-3, cells were fixed, permeabilized, and co-stained with Texas Red-conjugated anti-kappa polyclonal antibody and specific antibodies against ATF4 (A) and CHOP (B). Green and red image fields were superimposed to create ‘merge’ views. DIC and ‘merge’ were superimposed to generate ‘overlay’ views.
Supplemental material

Supplemental_Materials.zip

Download Zip (8 MB)

Reprints and Corporate Permissions

Please note: Selecting permissions does not provide access to the full text of the article, please see our help page How do I view content?

To request a reprint or corporate permissions for this article, please click on the relevant link below:

Academic Permissions

Please note: Selecting permissions does not provide access to the full text of the article, please see our help page How do I view content?

Obtain permissions instantly via Rightslink by clicking on the button below:

If you are unable to obtain permissions via Rightslink, please complete and submit this Permissions form. For more information, please visit our Permissions help page.