2,722
Views
20
CrossRef citations to date
0
Altmetric
Report

Infliximab crystal structures reveal insights into self-association

, , ORCID Icon, , ORCID Icon, , , , & show all
Pages 874-883 | Received 22 Feb 2017, Accepted 13 Apr 2017, Published online: 25 May 2017

Figures & data

Table 1. Crystallographic data collection and refinement statistics.

Figure 1. Crystal structures of infliximab Fc domain (A) and Fab domain (B). The Fc dimer is shown in (A), with one heavy chain shown in green and the symmetry-related chain shown in silver. N-linked glycans are shown in stick representation and the CH2 and CH3 sub-domains are labeled. The I212121 form of the Fab domain is shown in (B), with the heavy chain in green and the light chain in silver. Variable (VH and VL) and constant (CH1 and CL) regions are labeled.
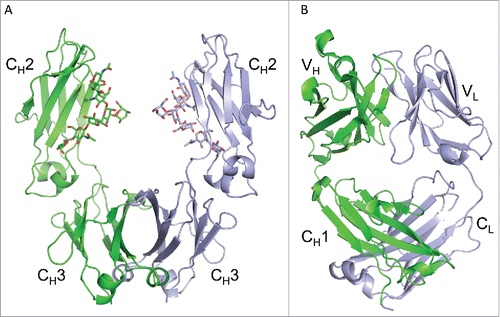
Figure 1. Crystal structures of infliximab Fc domain (A) and Fab domain (B). The Fc dimer is shown in (A), with one heavy chain shown in green and the symmetry-related chain shown in silver. N-linked glycans are shown in stick representation and the CH2 and CH3 sub-domains are labeled. The I212121 form of the Fab domain is shown in (B), with the heavy chain in green and the light chain in silver. Variable (VH and VL) and constant (CH1 and CL) regions are labeled.

Figure 2. Flexibility between the variable and constant regions of the infliximab Fab domain. Fab structures determined in C2221 (blue) and I212121 (green) crystal forms, aligned by their variable regions, show a ∼40° relative rotation of their constant regions, indicating intramolecular flexibility within the Fab domain.
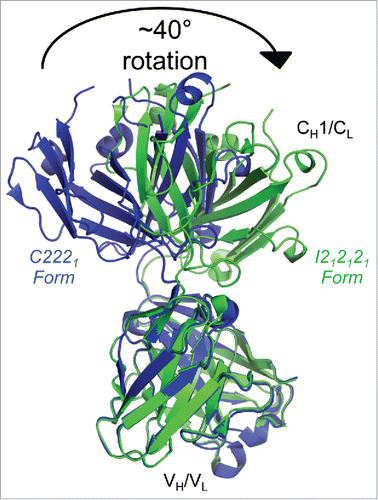
Figure 2. Flexibility between the variable and constant regions of the infliximab Fab domain. Fab structures determined in C2221 (blue) and I212121 (green) crystal forms, aligned by their variable regions, show a ∼40° relative rotation of their constant regions, indicating intramolecular flexibility within the Fab domain.

Figure 3. TNF binding does not affect the infliximab CDR loop structure. Fab structures in the unbound (blue; I212121 form) and TNFα-bound (red) states are overlaid. CDR loop residues involved in TNF binding are shown as sticks in darker coloring and are labeled. The antigen binding interface structure is unchanged in the bound and free states, indicating that antigen binding does not affect the structure of infliximab.
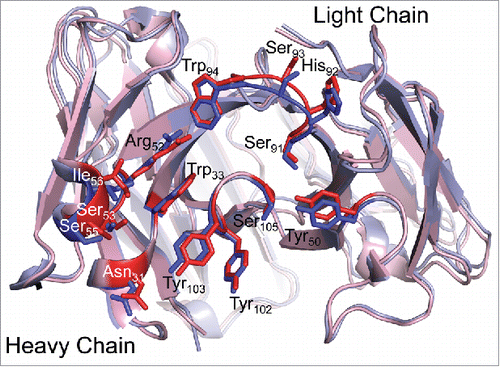
Figure 3. TNF binding does not affect the infliximab CDR loop structure. Fab structures in the unbound (blue; I212121 form) and TNFα-bound (red) states are overlaid. CDR loop residues involved in TNF binding are shown as sticks in darker coloring and are labeled. The antigen binding interface structure is unchanged in the bound and free states, indicating that antigen binding does not affect the structure of infliximab.

Figure 4. The Fab asymmetric unit contains a head-to-tail dimer, associated through light chain:light chain interactions in both crystal forms. Two Fab molecules (#1 and #2) and their variable and constant regions are labeled in the I212121 form (left) and the C2221 form (right). Heavy chains are shown in shades of green and light chains in shades of blue. In both crystal forms, Fab #1 is oriented with variable regions at the top, while Fab #2 variable regions are positioned at the bottom. The large contact area (> 1000 Å2) between light chains is larger than would be expected for typical crystal contacts, indicating a potential self-association interface in solution.
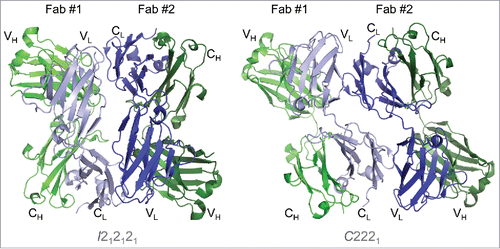
Figure 4. The Fab asymmetric unit contains a head-to-tail dimer, associated through light chain:light chain interactions in both crystal forms. Two Fab molecules (#1 and #2) and their variable and constant regions are labeled in the I212121 form (left) and the C2221 form (right). Heavy chains are shown in shades of green and light chains in shades of blue. In both crystal forms, Fab #1 is oriented with variable regions at the top, while Fab #2 variable regions are positioned at the bottom. The large contact area (> 1000 Å2) between light chains is larger than would be expected for typical crystal contacts, indicating a potential self-association interface in solution.

Figure 5. Fab:Fab contact interface in the I212121 crystal form. (A) A surface representation of the Fab asymmetric unit (dimer) is shown with heavy chains colored in shades of green and light chains in shades of blue. Interface residues are colored by residue type (green = polar, blue = basic, red = acidic, magenta = hydrophobic). (B) Each Fab domain is rotated outward 90° to expose the light chain:light chain interface residues, which are highlighted below in the light chain sequence. Residues common to both crystal form interfaces are underlined in the sequence. (C) Close-up view of Leu3 from one light chain positioned into a pocket created by Thr197, Lys145 and Glu143 in the adjacent light chain in the I212121 crystal form.
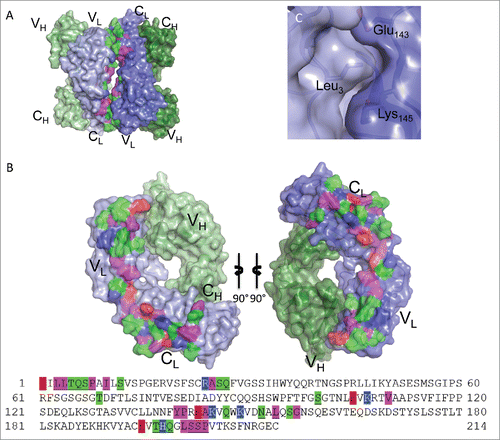
Figure 5. Fab:Fab contact interface in the I212121 crystal form. (A) A surface representation of the Fab asymmetric unit (dimer) is shown with heavy chains colored in shades of green and light chains in shades of blue. Interface residues are colored by residue type (green = polar, blue = basic, red = acidic, magenta = hydrophobic). (B) Each Fab domain is rotated outward 90° to expose the light chain:light chain interface residues, which are highlighted below in the light chain sequence. Residues common to both crystal form interfaces are underlined in the sequence. (C) Close-up view of Leu3 from one light chain positioned into a pocket created by Thr197, Lys145 and Glu143 in the adjacent light chain in the I212121 crystal form.

Figure 6. Fab:Fab contact interface in the C2221 crystal form. (A) A surface representation of the Fab asymmetric unit (dimer) is shown with heavy chains colored in shades of green and light chains in shades of blue. Interface residues are colored by residue type (green = polar, blue = basic, red = acidic, magenta = hydrophobic). (B) Each Fab domain rotated outward 90° to expose the light chain:light chain interface residues, which are highlighted below in the light chain sequence. Residues common to both crystal form interfaces are underlined. (C) A close-up view of Leu3 in the C2221 interface, positioned within a pocket created by Val191, Asp151, Asn152 and Lys190 of the adjacent Fab. The surrounding hydrogen bond interactions are shown as dashed lines.
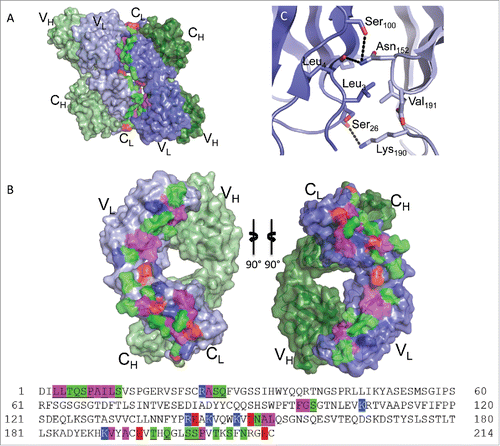
Figure 6. Fab:Fab contact interface in the C2221 crystal form. (A) A surface representation of the Fab asymmetric unit (dimer) is shown with heavy chains colored in shades of green and light chains in shades of blue. Interface residues are colored by residue type (green = polar, blue = basic, red = acidic, magenta = hydrophobic). (B) Each Fab domain rotated outward 90° to expose the light chain:light chain interface residues, which are highlighted below in the light chain sequence. Residues common to both crystal form interfaces are underlined. (C) A close-up view of Leu3 in the C2221 interface, positioned within a pocket created by Val191, Asp151, Asn152 and Lys190 of the adjacent Fab. The surrounding hydrogen bond interactions are shown as dashed lines.

Figure 7. Reversible self-association of full-length infliximab in solution. (A) SEC analysis of infliximab at increasing concentrations (0.5, 2.5, and 5 mg/mL) reveals a corresponding shift in the main peak to earlier retention times and a progressive asymmetry, indicative of self-association. (B) AUC-SV analysis of infliximab demonstrates that the sedimentation coefficient increases with concentration, and that two peaks become resolved at the highest concentration measured. Results from both methods are consistent with concentration-dependent, reversible self-association of infliximab.
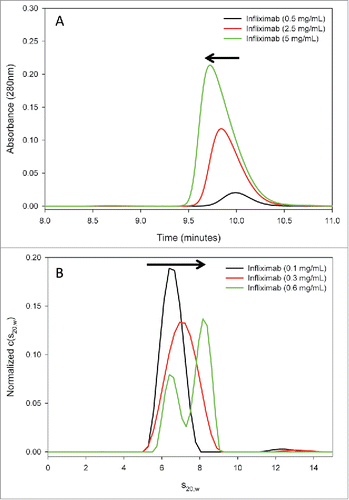
Figure 7. Reversible self-association of full-length infliximab in solution. (A) SEC analysis of infliximab at increasing concentrations (0.5, 2.5, and 5 mg/mL) reveals a corresponding shift in the main peak to earlier retention times and a progressive asymmetry, indicative of self-association. (B) AUC-SV analysis of infliximab demonstrates that the sedimentation coefficient increases with concentration, and that two peaks become resolved at the highest concentration measured. Results from both methods are consistent with concentration-dependent, reversible self-association of infliximab.

Table 2. Infliximab species measured by AUC-SE.

Figure 8. Measuring the affinity of infliximab self-association using AUC-SE. Experimental data (scatter plots) were fit to a monomer-dimer equilibrium model (C(cal), solid lines) to determine the equilibrium dissociation constant (KD) of 21 μM. Infliximab was evaluated at 0.07 mg/mL (A), 0.2 mg/mL (B), and 0.6 mg/mL (C). Samples were run at rotor speeds of 7500 (red), 10000 (blue), 12500 (green) and 15000 rpm (purple).
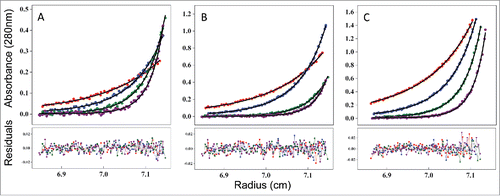
Figure 8. Measuring the affinity of infliximab self-association using AUC-SE. Experimental data (scatter plots) were fit to a monomer-dimer equilibrium model (C(cal), solid lines) to determine the equilibrium dissociation constant (KD) of 21 μM. Infliximab was evaluated at 0.07 mg/mL (A), 0.2 mg/mL (B), and 0.6 mg/mL (C). Samples were run at rotor speeds of 7500 (red), 10000 (blue), 12500 (green) and 15000 rpm (purple).

Figure 9. Infliximab self-association is localized to the Fab domain in solution. The infliximab Fc fragment does not show evidence of self-association by SEC (A) or AUC-SV (B). The SEC elution peak is symmetric and the retention time is consistent at all measured concentrations (A). Similarly, the sedimentation coefficient of the Fc fragment is consistent at all measured concentrations (B). In contrast, the Fab fragment shows evidence of reversible self-association by both SEC (C) and by AUC-SV (D), similar to the intact infliximab antibody ().
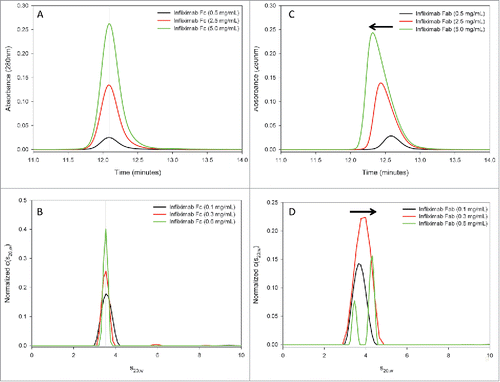
Figure 9. Infliximab self-association is localized to the Fab domain in solution. The infliximab Fc fragment does not show evidence of self-association by SEC (A) or AUC-SV (B). The SEC elution peak is symmetric and the retention time is consistent at all measured concentrations (A). Similarly, the sedimentation coefficient of the Fc fragment is consistent at all measured concentrations (B). In contrast, the Fab fragment shows evidence of reversible self-association by both SEC (C) and by AUC-SV (D), similar to the intact infliximab antibody (Fig. 7).

Reprints and Corporate Permissions

Please note: Selecting permissions does not provide access to the full text of the article, please see our help page How do I view content?

To request a reprint or corporate permissions for this article, please click on the relevant link below:

Academic Permissions

Please note: Selecting permissions does not provide access to the full text of the article, please see our help page How do I view content?

Obtain permissions instantly via Rightslink by clicking on the button below:

If you are unable to obtain permissions via Rightslink, please complete and submit this Permissions form. For more information, please visit our Permissions help page.