Figures & data
Table 1. Main features of the 9O12 V-domains and the humanized V-domains designed for generation of Fabs ACT004 to ACT018. Template and criteria: (a) human germline most similar to 9O12; (b) high sequence identity and identical canonical subclasses; (c) same antibody template for both V-domains; (d) high sequence identity and closely related canonical classes. T-cell epitope score represents the number of 9 mers with a score higher than arbitrary selected cut-off of 10 and 1. Canonical classes indicated here are those from the template. * indicates that L1–4/16A canonical subclass was restored after humanization. Packing angle is a prediction after pairing humanized variants of VL and VH. Z-score: a value in the [−1.0; +1.0] range indicates a high degree of humanness.
Figure 1. Design of humanized 9O12 V-domains. (A) Sequence alignment of the mouse 9O12 IGHV (9VH) (most similar human germline sequence being IGHV1–3*01) with 4 human or humanized IGHV templates (TH1: IGHV1–3*01; TH2: bevacizumab; TH3: IGHV1–46*01; TH4: NEW), the humanized 9O12 IGHV variants (VH1, VH2, VH3 and VH4) and the framework regions of their most similar human germline genes (CH1: IGHV1–3*01; CH2: IGHV3–23*04; CH3: IGHV1–46*01; CH4: IGHV4–38–2*02). The humanized variants that retained antigen-binding activity are highlighted in green. (B) Sequence alignment of the mouse 9O12 IGKV (9VL) (most similar human germline sequence being IGKV2–29*02) with 4 human or humanized IGKappaV templates (TL2b: bevacizumab; TL3b: IGKV2–29*02; TL7b: canakinumab; TL8b: REI), the humanized 9O12 IGKV (variants VL2b, VL3b, VL7b and VL8b) and the framework regions of their most similar human germline genes (CL2b: IGKV1–39*01; CL3b: IGKV2–29*02; CL7b: IGKV6–21*01; CL8b: IGKV1–33*01). The humanized variants that retained antigen-binding activity and acquired PpL recognition site are highlighted in green (or in blue if retaining antigen binding activity but not PpL recognition). CDRs are in italic, underlined, gray. Residues at key sitesCitation28,49 for canonical structures are highlighted in blue. Residues buried in VH/VL interfaces are underlined in yellow. Residues critical for PpL binding are highlighted in green. Based on the physico-chemical classes of the amino acids (AA), differences in the framework regions of mouse 9O12 and its humanized variants are classified into very similar AA (green), similar AA (blue), dissimilar AA (orange) and very dissimilar AA (red).
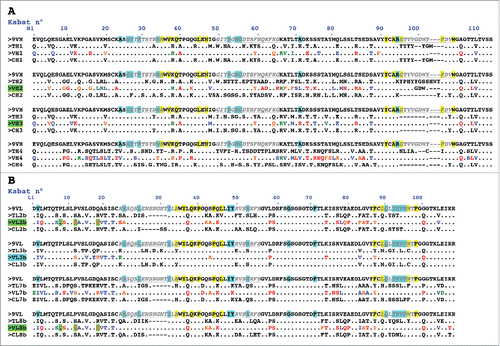
Figure 2. 3D structure of the humanized V-domains of ACT017 (VL8b and VH3 variants). (A) Stereo view with colored CDRs. Mutated residues exposed at the surface are in cyan. (B) VL domain with residues buried at the interface with VH in light pink. (C) VH domain with residues buried at the interface with VL in light green. (D) VH domain with the 2 mutated residues from CDR H2 in cyan.
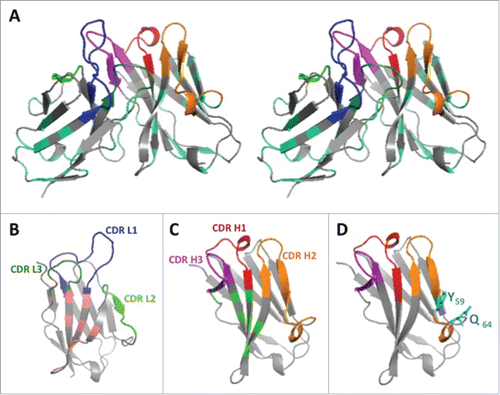
Table 2. V-domains pairing for generation of humanized antibody fragments and functional characteristics.
Figure 3. Primary screening of humanized anti-GPVI Fabs. (A-B) Western blot analysis under non-reducing conditions of light chain expression using anti-human kappa chain as primary antibody (A) or Fd expression using anti-human IgG Fd region as primary antibody (B). Deposit of 10 μL of supernatant. Numbers refer to ACT0xx variants. (a) trastuzumab Fab transiently expressed in similar conditions. (b) abciximab (Reopro®) 0.5μg. (C-D) ELISA selection of the best GPVI binders after developing with anti-human IgG (Fab specific)-peroxidase conjugate (C) or PpL-Peroxidase conjugate (D). Culture supernatants were analyzed after successive dilutions (1:10, 1:100, 1:1000) in C or (1:10, 1:50, 1:100, 1:1000 in D). Orange bars (−): culture supernatant with no Fab.
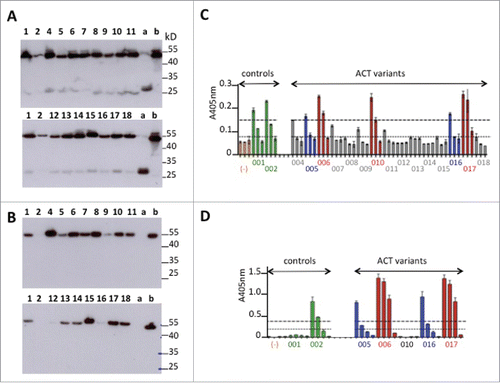
Figure 4. Kinetic parameters of the interaction between humanized Fab variants or Fab9O12 with immobilized GPVI-Fc as deduced from SPR analysis.
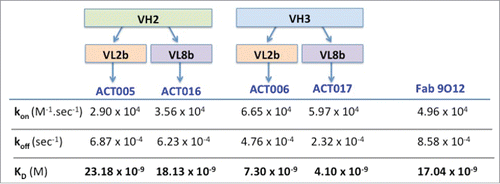
Figure 5. Purification and stability of ACT017. (A) SDS- PAGE analysis of PpL-purified ACT017 (500ng) after Coomassie staining (10% gel) (a-b) or Western-blotting (4–12% gel) with anti-kappa chain (c,e) or anti-Fd chain (d,f) antibody under non-reducing (nr) or reducing (r) conditions. (1) Molecular weight marker (kDa) (2) 500 ng of PpL-purified ACT017. (B) Mass spectrometry analysis of ACT017 by ESI-Q-ToF-MS at a protein concentration of 10 μM. (C) Typical elution profile of PpL purified ACT017 after gel filtration on a calibrated Superdex 75 10/300 GL column and stability profile under 4 temperatures in 3 different buffers. (D) Evolution of the purity of the main peak throughout the stability study for 3 buffers at 4 temperatures (−20°C to 42°C) as deduced from the gel filtration elution profile. Buffer 1: 50 mM Sodium acetate, pH 4.9. Buffer 2: 50 mM Sodium succinate, pH 5.1. Buffer 3: PBS pH 7.0.
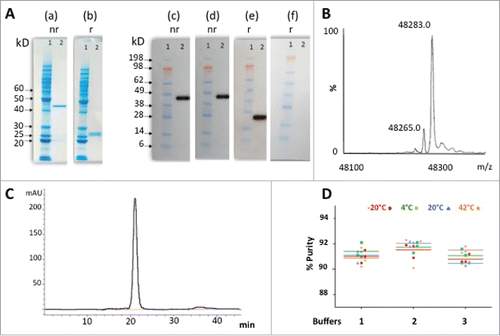
Figure 6. Overview of immunogenic potential of ACT017. (A) Putative T-cell epitope cluster found in ACT017 V-domains and main features. Clusters highlighted in green contain known Tregitope sequences. Cluster highlighted in blue contains homolog to known Tregitopes sequences. (B) Immunogenicity scale (Epimatrix protein score). Upper pane showcases: observed ADA responses in known antibodies. Lower pane showcases: predicted ADA responses in ACT017. All predictions are adjusted for the presence of Tregitopes.
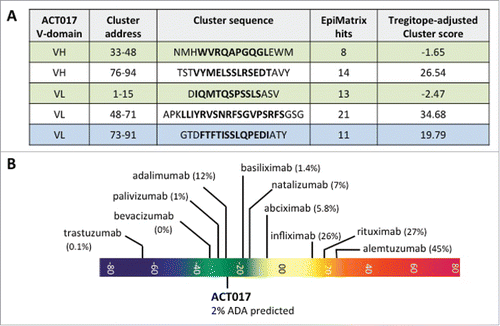
Figure 7. Functional characterization of ACT017 in vitro. (A) Isotherm binding curve of ACT017 to immobilized GPVI-Fc. (B) Inhibition of GPVI-Fc binding to immobilized collagen by increasing concentrations of ACT017. (C) In vitro binding of ACT017 conjugated to Alexa488 to human platelets analyzed by flow cytometry (red: whole blood; black: PRP). (D) Typical residual platelet aggregation as the ratio of the response in the presence of ACT017 to the response without ACT017 as a function of ACT017 concentration (Black: residual intensity, Gray: residual velocity). The insert shows a typical aggregation curve obtained after pre-incubation of human PRP with increasing concentrations of ACT017 (0–10 μg/mL).
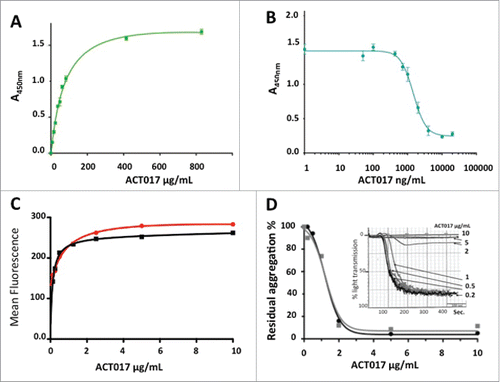
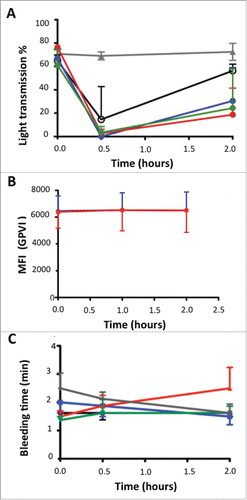
Figure 8. Effects of escalating doses of ACT017 on ex vivo collagen-induced blood platelet aggregation, GPVI expression level and bleeding time in 4 cynomolgus monkeys. (A) Mean intensity of collagen-induced platelet aggregation is expressed as a percent of light transmission. (B) GPVI expression level analyzed after immunolabeling with FITC-conjugated anti-human GPVI monoclonal antibody of blood samples and fluorescence measurement. (C) Average bleeding time evolution during the study. Average bleeding time at 30 min after injection of abciximab is out of the scale (> 30 min). Animals were treated with vehicle (gray triangle), ACT017 at 1 mg/kg (black circle), 2 mg/kg (blue), 4 mg/kg (red) and 8 mg/kg (green).