4,372
Views
21
CrossRef citations to date
0
Altmetric
Report

A high-throughput platform for population reformatting and mammalian expression of phage display libraries to enable functional screening as full-length IgG

, , ORCID Icon, , , , , , , , , & ORCID Icon show all
Pages 996-1006 | Received 27 Jan 2017, Accepted 29 May 2017, Published online: 31 Jul 2017

Figures & data

Figure 1. Schematic representation of batch reformatting of scFvs to IgGs. (A) Upper panel: Amplification of the phage display vector with 5′ primers annealing to VL FW1 and 3′ primers annealing to VH FW4. This results in the amplification of the whole plasmid except the linker between the VH and VL (dotted line). The primers carry complementary overhangs corresponding to the 5′ and 3′ ends of a donor fragment (B). This donor fragment represents the hinge and IgG1 constant domains followed by translation stop and polyA sites (in green) and the light chain control elements consisting of the LC promoter and signal sequence (in blue). This intermediate fragment is then fused in frame with VH and VL by means of In-Fusion technology. The resulting pool of plasmids is shown in the bottom panel (C, IgG intermediate pool). The IgG cassette from the intermediate vector pool is PCR amplified using 5′ primers that anneal to the FW1 of VH and 3′ primers that anneal to the FW4 of VL. The primers have overhangs to anneal to the signal sequence of HC and 5′ end of the Cκ or Cλ. The PCR products are then cloned into the IgG vector (D). The result is a pool of plasmid that codes for the entire HC and LC and can express IgG in mammalian cells. HSS, heavy chain signal sequence.
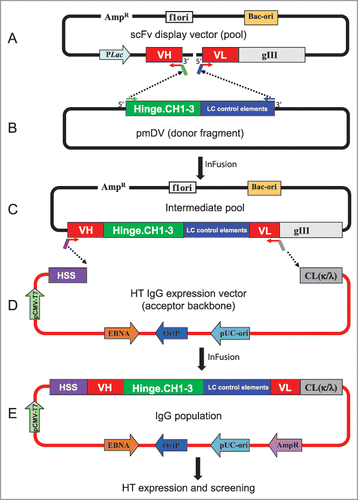
Figure 1. Schematic representation of batch reformatting of scFvs to IgGs. (A) Upper panel: Amplification of the phage display vector with 5′ primers annealing to VL FW1 and 3′ primers annealing to VH FW4. This results in the amplification of the whole plasmid except the linker between the VH and VL (dotted line). The primers carry complementary overhangs corresponding to the 5′ and 3′ ends of a donor fragment (B). This donor fragment represents the hinge and IgG1 constant domains followed by translation stop and polyA sites (in green) and the light chain control elements consisting of the LC promoter and signal sequence (in blue). This intermediate fragment is then fused in frame with VH and VL by means of In-Fusion technology. The resulting pool of plasmids is shown in the bottom panel (C, IgG intermediate pool). The IgG cassette from the intermediate vector pool is PCR amplified using 5′ primers that anneal to the FW1 of VH and 3′ primers that anneal to the FW4 of VL. The primers have overhangs to anneal to the signal sequence of HC and 5′ end of the Cκ or Cλ. The PCR products are then cloned into the IgG vector (D). The result is a pool of plasmid that codes for the entire HC and LC and can express IgG in mammalian cells. HSS, heavy chain signal sequence.

Figure 2. Maintenance of VH and VL pairing during batch reformatting of a mini-library of 31 scFvs with known sequences to full-length IgG. Antibody amplification steps of the reformatting process were done using either standard aqueous PCR conditions (A) or using emulsion PCR where DNA templates are separated within water-in-oil droplets (B). scFv DNA sequences from each pool were identified by their VH and VL CDR3 sequences. Numbers in the table show IgG sequences observed with the certain VH and VL combinations indicated. IgG having the original VH-VL pairing are indicated by shading. Values in square brackets indicate the % correct pairing rate in each population from 86 or 87 scFv sequences analyzed.
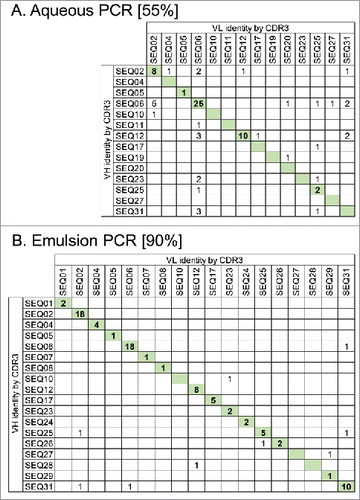
Figure 2. Maintenance of VH and VL pairing during batch reformatting of a mini-library of 31 scFvs with known sequences to full-length IgG. Antibody amplification steps of the reformatting process were done using either standard aqueous PCR conditions (A) or using emulsion PCR where DNA templates are separated within water-in-oil droplets (B). scFv DNA sequences from each pool were identified by their VH and VL CDR3 sequences. Numbers in the table show IgG sequences observed with the certain VH and VL combinations indicated. IgG having the original VH-VL pairing are indicated by shading. Values in square brackets indicate the % correct pairing rate in each population from 86 or 87 scFv sequences analyzed.

Figure 3. Representation of VH CDR3 sequences in scFv populations before and after batch reformatting for SiPF. Randomly chosen individual colonies were given an arbitrary identity based on their VH CDR3 sequence. Sequence representation is shown as a percentage frequency in scFv (129 sequences) or SiPF (176 sequences) populations. The 3 most frequent VH CDR3 sequences, and the representation of other sequences, is broadly the same for both populations. 16% (scFv) and 23% (SiPF) of the sequences in each population do not overlap, most likely due to sample size and the low probability of re-sampling relatively rare sequences.
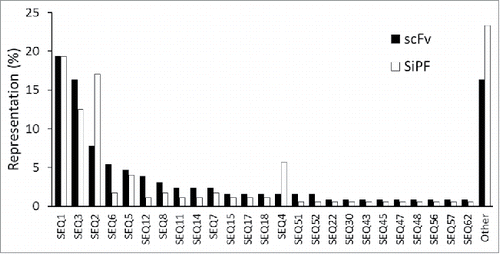
Figure 3. Representation of VH CDR3 sequences in scFv populations before and after batch reformatting for SiPF. Randomly chosen individual colonies were given an arbitrary identity based on their VH CDR3 sequence. Sequence representation is shown as a percentage frequency in scFv (129 sequences) or SiPF (176 sequences) populations. The 3 most frequent VH CDR3 sequences, and the representation of other sequences, is broadly the same for both populations. 16% (scFv) and 23% (SiPF) of the sequences in each population do not overlap, most likely due to sample size and the low probability of re-sampling relatively rare sequences.

Table 1. Comparison of variable domain sequences of phagemid scFv from Round 2 of selection and as VH and VL in IgG after batch reformatting to IgG.

Figure 4. (A) Expression of 1496 IgG in Expi293F cells. Cells were transfected with mini-prep DNA, harvested after 6 d and IgG expression levels was determined using octet protein A. The mean titer for this set of antibodies was 70 µg/ml. (B) Reproducibility of the high-throughput mammalian expression system. A set of 352 antibodies were expressed in 4 96-well blocks and the titer determined after 6-days (week 1). Two weeks later the same antibodies were re-expressed under the same conditions (week 2). The expression of each antibody in each of the separate instance is highly comparable.
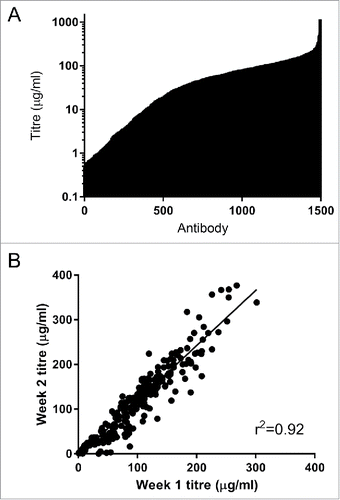
Figure 4. (A) Expression of 1496 IgG in Expi293F cells. Cells were transfected with mini-prep DNA, harvested after 6 d and IgG expression levels was determined using octet protein A. The mean titer for this set of antibodies was 70 µg/ml. (B) Reproducibility of the high-throughput mammalian expression system. A set of 352 antibodies were expressed in 4 96-well blocks and the titer determined after 6-days (week 1). Two weeks later the same antibodies were re-expressed under the same conditions (week 2). The expression of each antibody in each of the separate instance is highly comparable.

Figure 5. More potent anti-cytokine antibodies are identified by SiPF than by scFv screening. Comparison of potency of the 2 leading antibodies identified from scFv screening (Ab048) or SiPF screening (Ab049) of phage display selections that were performed to identify an antagonistic antibody for a soluble cytokine. Neutralization of 1nM cytokine-induced receptor activation by Ab048 and Ab009 are shown in a cell-based receptor reporter enzyme complementation assay (PathHunter, DiscoverRx).
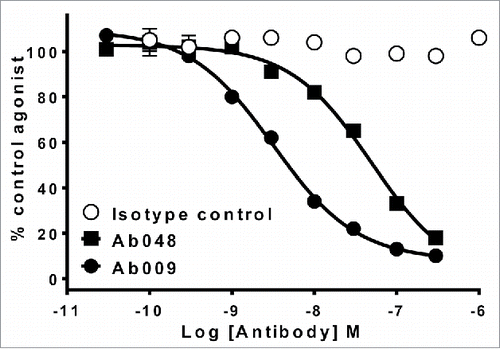
Figure 5. More potent anti-cytokine antibodies are identified by SiPF than by scFv screening. Comparison of potency of the 2 leading antibodies identified from scFv screening (Ab048) or SiPF screening (Ab049) of phage display selections that were performed to identify an antagonistic antibody for a soluble cytokine. Neutralization of 1nM cytokine-induced receptor activation by Ab048 and Ab009 are shown in a cell-based receptor reporter enzyme complementation assay (PathHunter, DiscoverRx).

Figure 6. Flow diagrams comparing typical routes from phage display selection to the identification of functional antibodies, highlighting the utility of the SiPF platform in reducing surrogate steps (e.g., scFv format, binding based / biochemical) assays. Rapid conversion of phage scFv to IgG allows earlier analysis of larger numbers of IgG in more relevant, functional cell-based assays.
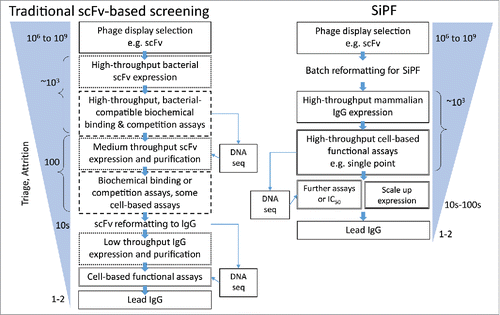
Figure 6. Flow diagrams comparing typical routes from phage display selection to the identification of functional antibodies, highlighting the utility of the SiPF platform in reducing surrogate steps (e.g., scFv format, binding based / biochemical) assays. Rapid conversion of phage scFv to IgG allows earlier analysis of larger numbers of IgG in more relevant, functional cell-based assays.

Figure 7. FMAT analysis of cell-binding of anti FPR1 antibodies as IgG supernatant generated using the SiPF platform. Four different FPR1 binding antibodies identified from cell-based phage display selections are shown. Hy38-1 SiPF is a positive control antibody known to recognize FPR133 that has been expressed using the SiPF platform.
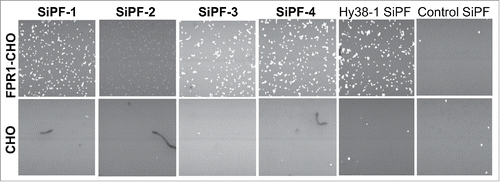
Figure 7. FMAT analysis of cell-binding of anti FPR1 antibodies as IgG supernatant generated using the SiPF platform. Four different FPR1 binding antibodies identified from cell-based phage display selections are shown. Hy38-1 SiPF is a positive control antibody known to recognize FPR133 that has been expressed using the SiPF platform.

Table 2. Primers for intermediate pool generation. Sequences in red are complementary to the 5′ end of VL FW1 (5′ primers) or the 3′ end of VH FW4 (3′ primers). Sequences in blue are overhangs in 5′ primers that are complementary to the LC control elements in the donor fragment. Sequences in green are overhangs in 3′ primers that are complementary to the hinge region of IgG1 in the donor fragment.

Table 3. Primers for final IgG pool generation. Sequences in red are complementary to 5′ end of VH FW1 (5′ primers) or the 3′ end of VL FW4 (3′ primers). Sequences in blue are overhangs in 5′ primers that are complementary to the HC signal sequence region of the IgG acceptor vector. Sequences in black are overhangs in 3′ primers that are complementary to the 5′ end of either the kappa or lambda CL region of the IgG acceptor vector.

Reprints and Corporate Permissions

Please note: Selecting permissions does not provide access to the full text of the article, please see our help page How do I view content?

To request a reprint or corporate permissions for this article, please click on the relevant link below:

Academic Permissions

Please note: Selecting permissions does not provide access to the full text of the article, please see our help page How do I view content?

Obtain permissions instantly via Rightslink by clicking on the button below:

If you are unable to obtain permissions via Rightslink, please complete and submit this Permissions form. For more information, please visit our Permissions help page.