6,387
Views
38
CrossRef citations to date
0
Altmetric
Report

Characterization of highly concentrated antibody solution - A toolbox for the description of protein long-term solution stability

, , ORCID Icon, &
Pages 1169-1185 | Received 07 Feb 2017, Accepted 30 May 2017, Published online: 19 Jul 2017

Figures & data

Figure 1. Monomer, HMW, and LMW contents of the tested antibody determined with the help of size-exclusion chromatography. Plotted are conditions after buffer exchange with original mAb concentrations of 120 and 180 mg/ml, at pH 5, pH 7, and pH 9 without additive (a) and with 150 mM glycine (b), as well as samples at pH 7 with 160 mM Na2SO4 and samples at pH 9 containing 1.2 (m/V)% PEG4000 (c).
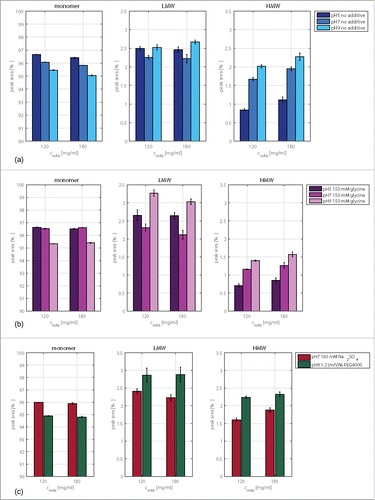
Figure 1. Monomer, HMW, and LMW contents of the tested antibody determined with the help of size-exclusion chromatography. Plotted are conditions after buffer exchange with original mAb concentrations of 120 and 180 mg/ml, at pH 5, pH 7, and pH 9 without additive (a) and with 150 mM glycine (b), as well as samples at pH 7 with 160 mM Na2SO4 and samples at pH 9 containing 1.2 (m/V)% PEG4000 (c).

Figure 2. ζ-potential values of mAb at 10 mg/ml, pH 5–11, with and without 150 mM glycine, 2 (m/V)% PEG4000, and 160 mM Na2SO4, respectively, in solution determined by laser Doppler microelectrophoresis.
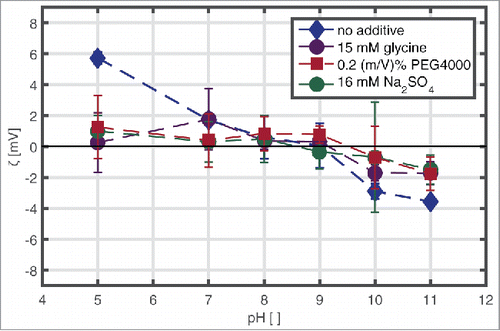
Figure 2. ζ-potential values of mAb at 10 mg/ml, pH 5–11, with and without 150 mM glycine, 2 (m/V)% PEG4000, and 160 mM Na2SO4, respectively, in solution determined by laser Doppler microelectrophoresis.

Figure 3. Comparison of the viscosity values of samples with mAb concentrations of 120 and 180 mg/ml at pH 5, pH 7, and pH 9 with and without additive in solution.
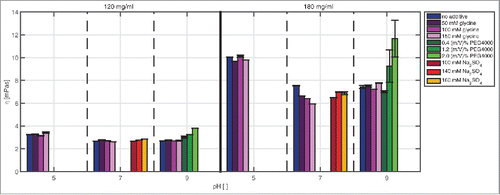
Figure 3. Comparison of the viscosity values of samples with mAb concentrations of 120 and 180 mg/ml at pH 5, pH 7, and pH 9 with and without additive in solution.

Figure 4. Tm1, Tm2, and Tagg values of mAb samples in a concentration range from 1–180 mg/ml at pH 7 without additive in solution determined over a temperature ramp ranging from 20–90°C.
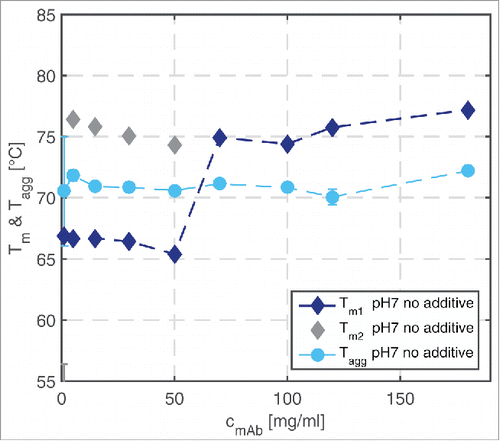
Figure 4. Tm1, Tm2, and Tagg values of mAb samples in a concentration range from 1–180 mg/ml at pH 7 without additive in solution determined over a temperature ramp ranging from 20–90°C.

Figure 5. Comparison of Tm1 (a) and Tagg (b) values of samples with mAb concentrations of 120 and 180 mg/ml at pH 5, pH 7, and pH 9 with and without selected additives.
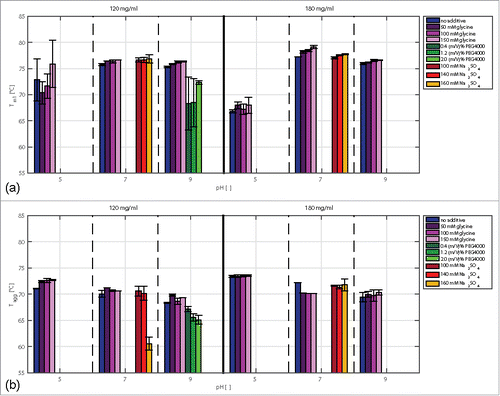
Figure 5. Comparison of Tm1 (a) and Tagg (b) values of samples with mAb concentrations of 120 and 180 mg/ml at pH 5, pH 7, and pH 9 with and without selected additives.

Figure 6. ωCO values of mAb samples without additive in solution as a function of protein concentration and pH (a). Impact of pH with an additive in solution, namely, 150 mM glycine (b), 160 mM Na2SO4 (c), and 2 (m/V)% PEG4000 (d), on the viscoelastic response. The gray area symbolizes the critical ωCO region. Above this region, the viscoelastic response indicates stable mAb solutions. ωCO values below this region indicate samples that might undergo phase transition.
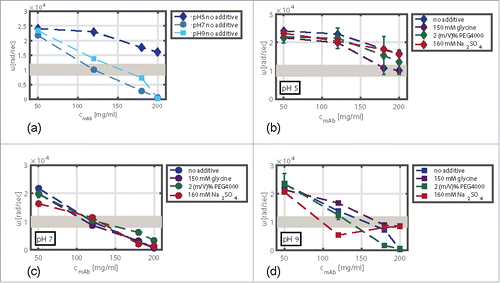
Figure 6. ωCO values of mAb samples without additive in solution as a function of protein concentration and pH (a). Impact of pH with an additive in solution, namely, 150 mM glycine (b), 160 mM Na2SO4 (c), and 2 (m/V)% PEG4000 (d), on the viscoelastic response. The gray area symbolizes the critical ωCO region. Above this region, the viscoelastic response indicates stable mAb solutions. ωCO values below this region indicate samples that might undergo phase transition.

Figure 7. Scoring of the phase behavior of mAb in a pH range from 5 to 9, a protein concentration range from 120 to 225 mg/ml, and (a) 0–250 mM glycine, (b) 0–2 (m/V)% PEG4000, and (c) 0–160 mM Na2SO4 visualized as 3D plots. The plates were stored at a constant temperature of 20°C. The scoring was done after 40 d of incubation based on the visual evaluation of the pictures taken by the Rock Imager. The blue round symbols stand for samples containing soluble mAb molecules, the small light red squares symbolize light precipitation in the middle of the well, and the dark red squares symbolize heavy precipitation.

Figure 7. Scoring of the phase behavior of mAb in a pH range from 5 to 9, a protein concentration range from 120 to 225 mg/ml, and (a) 0–250 mM glycine, (b) 0–2 (m/V)% PEG4000, and (c) 0–160 mM Na2SO4 visualized as 3D plots. The plates were stored at a constant temperature of 20°C. The scoring was done after 40 d of incubation based on the visual evaluation of the pictures taken by the Rock Imager. The blue round symbols stand for samples containing soluble mAb molecules, the small light red squares symbolize light precipitation in the middle of the well, and the dark red squares symbolize heavy precipitation.

Figure 8. Scoring of analytical results is shown in relation to the long-term colloidal stability (a). The subplots from top to bottom show the predicted impact at pH 5, pH 7, and pH 9 with mAb concentrations of 120 and 180 mg/ml without additive in solution, with the addition of 150 mM glycine, 1.2 (m/V)% PEG4000, and 160 mM Na2SO4, respectively. The scoring of the phase behavior at t40 of similar samples is depicted on the right hand side for easier comparison (b).
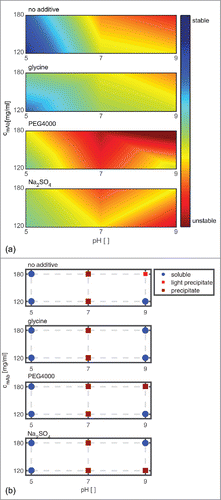
Figure 8. Scoring of analytical results is shown in relation to the long-term colloidal stability (a). The subplots from top to bottom show the predicted impact at pH 5, pH 7, and pH 9 with mAb concentrations of 120 and 180 mg/ml without additive in solution, with the addition of 150 mM glycine, 1.2 (m/V)% PEG4000, and 160 mM Na2SO4, respectively. The scoring of the phase behavior at t40 of similar samples is depicted on the right hand side for easier comparison (b).
Supplemental material

Supplementary_Materials.pdf

Download PDF (494.5 KB)