3,264
Views
15
CrossRef citations to date
0
Altmetric
Report

Pharmacokinetics of an intracerebroventricularly administered antibody in rats

, , &
Pages 1210-1215 | Received 16 Mar 2017, Accepted 20 Jun 2017, Published online: 27 Jul 2017

Figures & data

Figure 1. Schematic diagram of animal experiments in rat brain. The diagram outlines the brain structure and indicates the position of indwelling catheters used for ICV administration and CSF sampling. IgG and Inulin were co-administered into the lateral ventricle. CSF was collected from the cisterna magna, in which CSF accumulates.

Figure 1. Schematic diagram of animal experiments in rat brain. The diagram outlines the brain structure and indicates the position of indwelling catheters used for ICV administration and CSF sampling. IgG and Inulin were co-administered into the lateral ventricle. CSF was collected from the cisterna magna, in which CSF accumulates.

Figure 2. Concentration–time profiles of (A) IgG and (B) inulin in CSF after ICV administration. IgG and inulin were co-administered into the rat's lateral ventricle, and CSF was collected from the cisterna magna time-sequentially. The concentrations of IgG and inulin were measured by ligand binding assay using Gyrolab and ELISA, respectively. Each point with a vertical bar represents mean ± SD (n = 3)
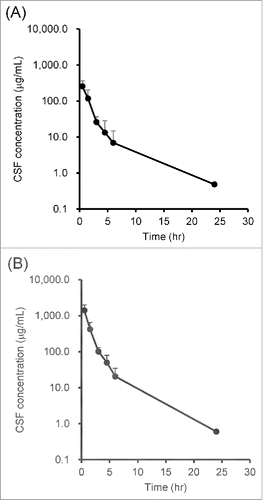
Figure 2. Concentration–time profiles of (A) IgG and (B) inulin in CSF after ICV administration. IgG and inulin were co-administered into the rat's lateral ventricle, and CSF was collected from the cisterna magna time-sequentially. The concentrations of IgG and inulin were measured by ligand binding assay using Gyrolab and ELISA, respectively. Each point with a vertical bar represents mean ± SD (n = 3)

Table 1. PK parameters of IgG in CSF. CSF concentration–time profiles of IgG were analyzed with a non-compartment model. Vdss, volume of distribution at steady-state; V0, volume of distribution at 0 hour.

Table 2. PK parameters of inulin in CSF. CSF concentration–time profiles of inulin were analyzed with a non-compartment model. Vdss, volume of distribution at steady-state; V0, volume of distribution at 0 hour.

Figure 3. Plasma concentration–time profiles of IgG after (A) ICV and (B) IV administration. (A) IgG and inulin were co-administered into the rat's lateral ventricle and plasma was collected time-sequentially. (B) IgG and inulin were co-administered into the rat's tail vein, and blood was collected. The concentrations of IgG in CSF and plasma were measured by ligand binding assay. Each point represents mean ± SD (n = 3)
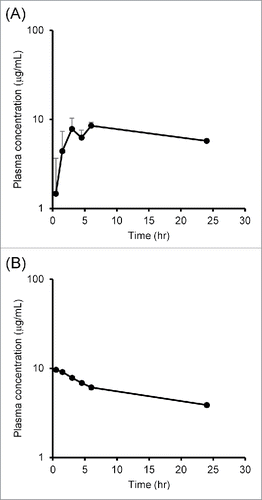
Figure 3. Plasma concentration–time profiles of IgG after (A) ICV and (B) IV administration. (A) IgG and inulin were co-administered into the rat's lateral ventricle and plasma was collected time-sequentially. (B) IgG and inulin were co-administered into the rat's tail vein, and blood was collected. The concentrations of IgG in CSF and plasma were measured by ligand binding assay. Each point represents mean ± SD (n = 3)

Figure 4. Transfer ratio from CSF to plasma calculated by deconvolution analysis. Plasma concentrations of IgG that had been administered intracerebroventricularly and systemically were used for deconvolution analysis. A weighting function that shows the relationship between time and transfer rate was determined, and then the cumulative amount of the weighting function against the dosing amount was calculated.
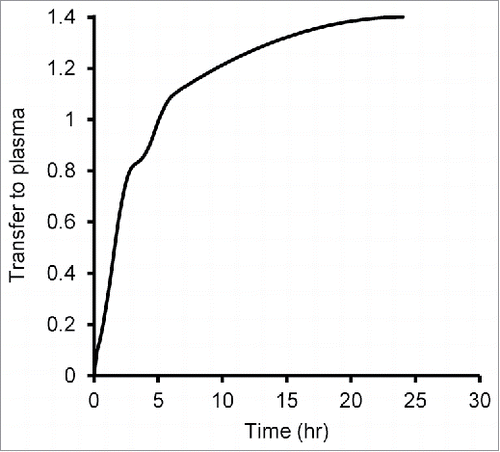
Figure 4. Transfer ratio from CSF to plasma calculated by deconvolution analysis. Plasma concentrations of IgG that had been administered intracerebroventricularly and systemically were used for deconvolution analysis. A weighting function that shows the relationship between time and transfer rate was determined, and then the cumulative amount of the weighting function against the dosing amount was calculated.

Figure 5. A model of the elimination of an antibody from CSF. Transfer clearance and diffusion rate (shown by dotted arrows) of an antibody are generally small; on the other hand, clearance via bulk flow (shown by a solid large arrow) is large.

Figure 5. A model of the elimination of an antibody from CSF. Transfer clearance and diffusion rate (shown by dotted arrows) of an antibody are generally small; on the other hand, clearance via bulk flow (shown by a solid large arrow) is large.

Reprints and Corporate Permissions

Please note: Selecting permissions does not provide access to the full text of the article, please see our help page How do I view content?

To request a reprint or corporate permissions for this article, please click on the relevant link below:

Academic Permissions

Please note: Selecting permissions does not provide access to the full text of the article, please see our help page How do I view content?

Obtain permissions instantly via Rightslink by clicking on the button below:

If you are unable to obtain permissions via Rightslink, please complete and submit this Permissions form. For more information, please visit our Permissions help page.