Figures & data
Figure 1. Virtual 2D-PAGE of the HCP immunogen based on MS-protein identifications. Identified proteins were plotted by database molecular weight and pI. spot size is scaled to relative protein abundance as determined by Mascot emPAI. Null cell HCPs span the molecular weight range from ∼5 to 450 kDa with pls ranging from 3–12.

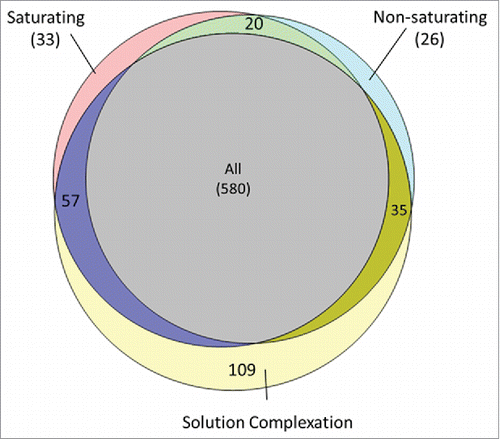
Figure 2. Distribution of HCP identifications among the saturating, non-saturating and solution complexation groups. HCP identification was highly similar between the saturating and non-saturating conditions with few unique identifications to either group (< 4%). Solution complexation before bead addition yielded unique HCP identifications compared with the direct bead binding methods (∼13%).

Table 1. Total protein recovery from each affinity purification sample group. Saturating, non-saturating, and solution complexation using the anti-HCP reagent yielded the greatest amounts of protein followed by the IgG negative control bead binding condition and the unprimed negative control beads.
Figure 3. Comparison of HCP protein identifications in the anti-HCP immunocapture compared with the IgG and unprimed bead negative controls. 579 proteins were uniquely found in the anti-HCP immunocapture, indicating specific immunoreactivity with the ELISA reagent. HCPs identified in both the anti-HCP and negative control immnunocaptures have ambiguous coverage and can be analyzed for specific reactivity on the basis of differential abundance.

Figure 4. Virtual 2D-PAGE comparing HCPs identified in the null cell immunogen without ELISA coverage (gray) with HCPs that have unambiguous immunoreactivity with the anti-HCP reagent (red) as assessed by unique affinity-purification MS identification relative to negative controls. Proteins recognized by the ELISA reagent span the molecular weight and pI range. Spot size is scaled relative to protein abundance in the immunogen according to Mascot emPAI statistic.

Figure 5. Evaluation of anti-HCP coverage across the molecular weight and pI distribution by protein number and percent coverage. compares the number of HCPs in each molecular weight bin compared with the number recognized by the Cygnus reagent, and shows the percent coverage as a function of molecular weight. compares the number of HCPs identified in each pI bin compared with the number recognized by the Cygnus reagent, while shows the percent coverage as a function of pI.

Table 2. The 25 most abundant downstream impurities assessed by emPAI in Protein A eluate of a therapeutic mAb. Proteins with specific immunoreactivity are noted in the anti-HCP coverage. Proteins described previously in the literature as downstream impurities in antibodies are noted. HCPs with specific immunoreactivity determined by unique identification in the anti-HCP immunocapture are denoted. HCPs with coverage determined by interrogation of differential protein abundance between the positive and negative affinity purifications are also noted using an αsuperscript. Among the top 25 impurities identified, only 2 lacked ELISA coverage as assessed by affinity purification.
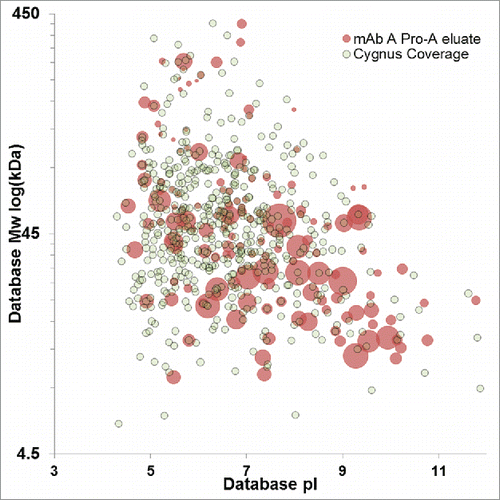
Figure 6. Virtual 2D-DIGE comparison of downstream impurities identified in the Protein A eluate of mAb A (red) and HCPs with ELISA coverage identified uniquely by anti-HCP affinity purification (gray). Protein A impurities with a concentric gray dot have confirmed ELISA immunoreactivity. Protein A impurity spot size is scaled relative to protein abundance, while fixed spot size is used for HCPs identified by anti-HCP affinity purification.

Figure 7. Comparison of HCP abundance in anti-HCP immunocapture compared with IgG negative control (open) and unprimed bead control (solid). Log2 fold change is plotted for each protein. Proteins were deemed to have immunoreactivity if the protein abundance in the anti-HCP immunocapture was greater than in the negative controls.

