
Figures & data
Table 1. Topological properties in 6 static snapshots of the collaboration network.
Figure 1. Collaborative project distribution in each year.
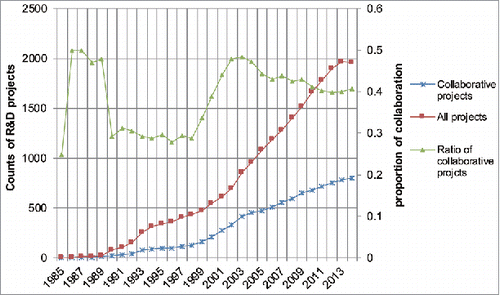
Figure 2. Collaboration network in the years: (A) 1989; (B) 1994; (C) 1999; (D) 2004; (E) 2009; (F) 2014. The main component of the network at each time point is displayed, except the one in 1989 (A) that shows the whole network. In the network, nodes denote the organizations involved in collaborative relationships and are represented as edges. Node size is scaled to the number of edges an organization has (only comparable within the network at a specific time point). The thickness of edges represents the frequency between 2 nodes. Loops, referring to edges that share the head and the end, are eliminated from data collection. The colors of nodes represent different forms of organizations: the purple represents pharmaceutical companies; the green represents DBFs; the yellow represents PROs; and the gray represents other forms. The edges are also colored according to the collaboration modes between nodes in terms of their specific organizational forms, with magenta between 2 pharmaceutical companies; blue between a pharmaceutical company and a DBF; light cyan between 2 DBFs; orange between a pharmaceutical company and a PRO; brick red between a DBF and a PRO; and gray between others.
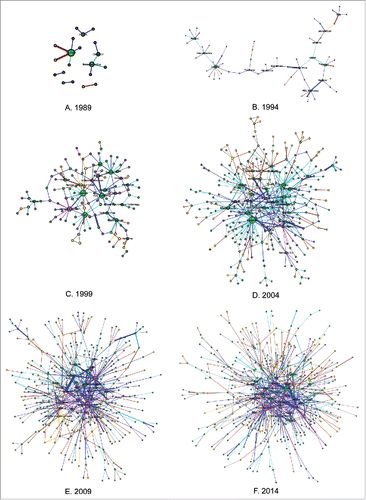
Figure 3. Distributions of different kinds of participants and varying relationships among them over time.
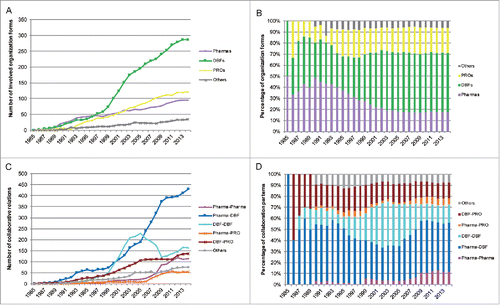
Figure 4. The cumulative normalized degree of the top 5 players with the highest degree over the 6 snapshots of the collaboration network. Organizations with an asterisk are large pharmaceutical companies.
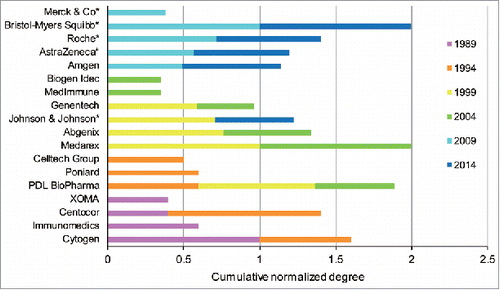
Figure 5. (A) The number of collaborative projects with identified technological profiles that launched every 2 y. (B) The number of relationships changed by M&A activities every 2 y.
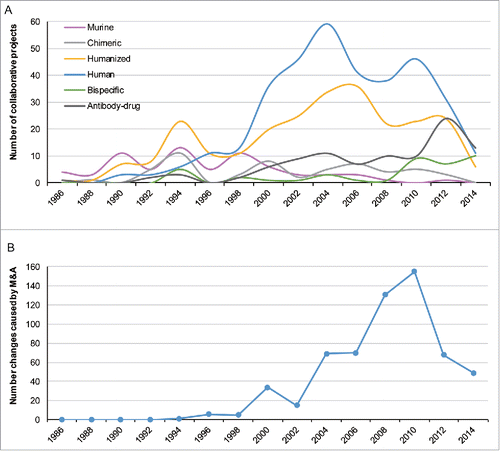
Table 2. The basic technological innovation profiles of some DBFs.
Figure 6. The topological shift of DBFs and pharmaceutical companies in the network evolution.
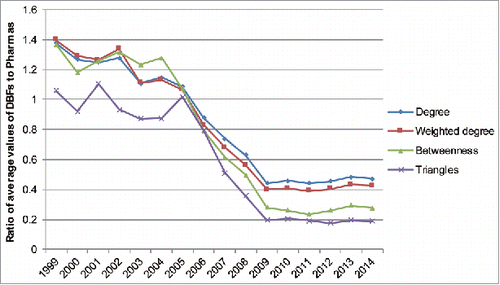
Table 3. Important mergers and acquisitions influencing the position changes in the collaboration network.