Figures & data
Table 1. Surface and molecular attributes of mAbA, mAbB and mAbC. Molecular weights of mAbA, mAbB and mAbC were determined by analyzing the monomer peak eluted from a size exclusion chromatography column using a miniDawn TREOS MALS detector. Partial molar volume of the antibodies was determined by performing a densimetry assay as a function of antibody concentration in 25 mM Na-acetate buffer at pH 5.5 at 20°C. Total point charges were determined by summing the predicted point charges of solvent accessible residues at pH 5.5 using a homology model of mAbA, mAbB and mAbC. The surface aggregation propensity (SAP) score which is a measure of the surface hydrophobicity of mAb molecules was calculated using molecular dynamics simulations.
Figure 1. Preferential interactions of mAbA (black), mAbB (red) and mAbC (blue) with the excipients trehalose (A, D), NaCl (B, E) and L-arginine.HCl (C, F) in the concentration range of 0–0.4 molal at room temperature. Vapor pressure osmometry measurements were carried out at room temperature to determine the differential change in protein chemical potential upon excipient addition, (A–C), and the corresponding preferential interaction co-efficient at constant co-solute chemical potential, Γμ3 (D–F), for each antibody-excipient combination as indicated. Error bars denote the propagated standard deviation of the osmolality data that is used to calculate
and Γμ3 at each concentration.
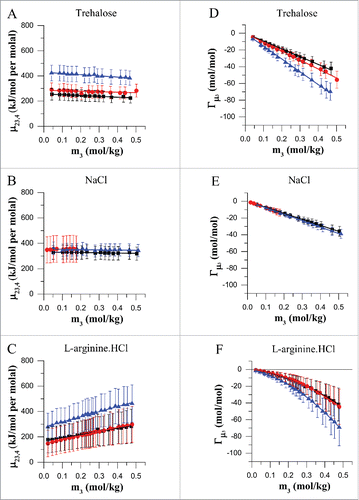
Table 2. Best fit equations for the preferential interaction co-efficient at constant co-solute chemical potential, Γμ3, and transfer free energy, Δμ2, transfer, as a function of excipient molality. The preferential interaction co-efficient data for trehalose and NaCl was fitted using a linear fitting algorithm and that for L-arginine.HCl was fitted using a non-linear fitting algorithm in Origin. The error bars in the bracket denote the standard error of fit. Transfer free energy values, Δμ2, transfer were calculated by integrating the fitting equations for as a function of excipient molality (m3) for the indicated combinations of protein and excipient at room temperature using vapor pressure osmometry technique.
Figure 2. Transfer free energy for mAbA (A), mAbB (B) and mAbC (C). Transfer free energies, Δμ2,transfer, for mAbA, mAbB and mAbC were calculated for the transfer from 25 mM Na-acetate buffer at pH 5.5 to the same buffer containing, additionally either trehalose (black), sodium chloride (red) or L-arginine.HCl (blue) at 20°C.
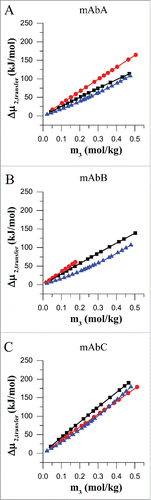
Figure 3. ΔTm analysis for the Fab, P1 and P2 transitions of mAbA (A), mAbB (B) and mAbC (C). Shift in Tm values with respect to 25 mM Na-acetate buffer alone, ΔTm, are plotted. Positive ΔTm values indicate an increase in the Tm value compared to that in the presence of buffer alone and vice versa. NaCl and L-arginine.HCl were used at a final concentration of 100 mM, whereas trehalose was used at a final concentration of 200 mM.
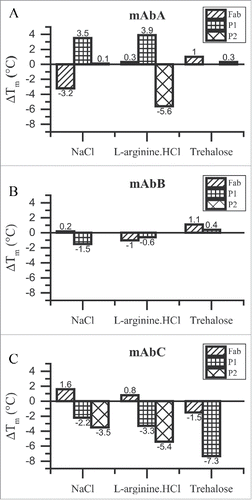
Figure 4. kD analysis for mAbA (A), mAbB (B) and mAbC (C) in 25 mM Na-acetate, pH 5.5 buffer alone or in combination with 100 mM sodium chloride, 100 mM L-arginine.HCl or 200 mM trehalose. DLS measurements were conducted at 25°C to estimate the apparent diffusion co-efficient of mAbA and mAbB in the concentration range of 0–25 mg/mL and from 0–4 mg/mL for mAbC. The resulting data were fit with Origin's linear fitting algorithm to estimate the DLS interaction parameter “kD” value, which has been previously shown to correlate with the reversible self-association of proteins in solution. Error bars represent the standard error in the estimation of the slope of the linear fit.
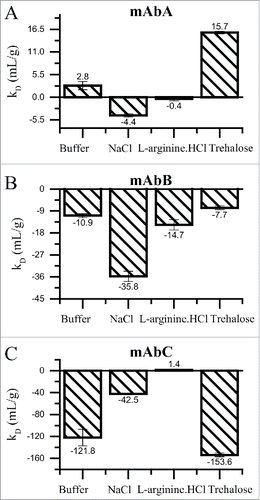
Table 3. Aggregation kinetics and apparent activation free energy change for aggregation of mAbA, mAbB and mAbC. mAbA and mAbB were incubated at 52.5 °C and mAbC was incubated at 42.5 °C with either 25 mM Na-acetate buffer at pH 5.5 alone or in combination with the indicated excipient. The % monomer loss data was fitted as a function of time to obtain a first order monomer loss rate constant “k”. The ratio k/k0 represents the ratio of the first order aggregation rate constant in the presence of the indicated excipient compared to the rate constant for a given antibody in the presence of 25 mM Na-acetate buffer alone. The activation transfer free energy, ΔΔμ2,transfer was determined from the k/k0 values by assuming a hypothetical kinetic pathway involving a single rate determining activation step. The values for mAbC in the presence of NaCl are omitted due to negligible change in % monomer over the course of incubation at the accelerated temperature of 42.5 °C.
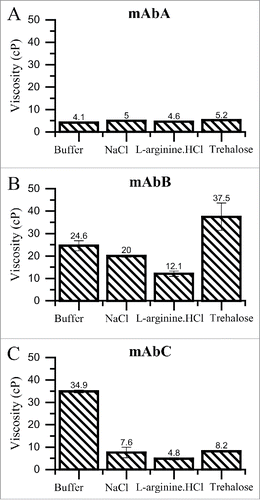
Figure 5. Viscosity of mAbA (A), mAbB (B) and mAbC (C) solutions at 20°C in the presence of the indicated excipient. Dynamic viscosity of concentrated solutions of mAbA, mAbB and mAbC were determined using cone and plate rheometry at 20°C at a final protein concentration of 100 mg/mL in either 25 mM Na-acetate, pH 5.5 buffer alone or with the addition of 100 mM NaCl, 100 mM L-arginine.HCl or 200 mM trehalose.