Figures & data
Figure 1. Agonistic activities of SF2 antibodies by the HEK-Blue NF-κB reporter assay. (A) Increasing concentrations (10 ng/mL to 1000 ng/mL) of SF2IgG1, SF2IgG1_R, SF2IgG1_RE and SF2IgG1_E345R antibodies were applied to HEK-Blue: OX40 cells, and agonistic activities of the antibodies were assessed by the HEK-Blue NF-κB reporter assay. The agonistic activities of SF2 antibodies, normalized as percent activity relative to that driven by 1 μg/mL OX40 ligand, were plotted against the concentrations of test antibodies (Data expressed as mean ± SEM, n). (B) Increasing concentrations (1 ng/mL to 10000 ng/mL) of SF2IgG1 and SF2IgG1_RE antibodies were assessed for binding to OX40 receptors expressed on HEK-Blue: OX40 cells by flow cytometry assays. Mean fluorescence signals were plotted against the concentrations of test antibodies (Data expressed as mean ± SEM, n
2). (C) Similar HEK-Blue NF-κB reporter assays were set up to study the agonistic activities of SF2IgG2σ, SF2IgG2σ_RE and SF2IgG2σ_E345R antibodies (Data expressed as mean ± SEM, n
2).
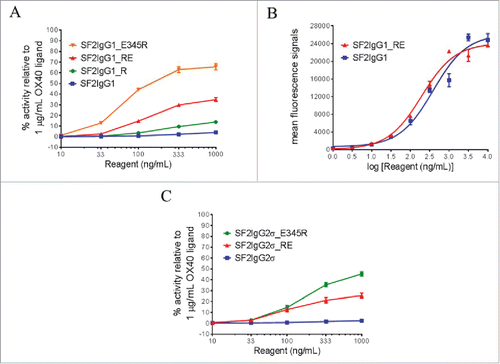
Figure 2. Assessment of monodispersity and multimerization of SF2IgG1 and SF2IgG1_RE. (A) SEC profiles of SF2IgG1 and SF2IgG1_RE antibodies in solution. The y axes are absorbance values at 280 nm. The x axes are retention times in minutes. (B) NanoBRET PPI assay for SF2IgG1 and SF2IgG1_RE. Increasing concentrations (from 10 ng/mL to 1000 ng/mL) of both Nanoluc donor antibody and Halotag receptor antibody were applied to HEK-Blue: OX40 cells and NanoBRET PPI assays were conducted. Mean Corrected BRET ratio were plotted against the concentrations of test antibodies (Data expressed as mean ± SEM, n 2).
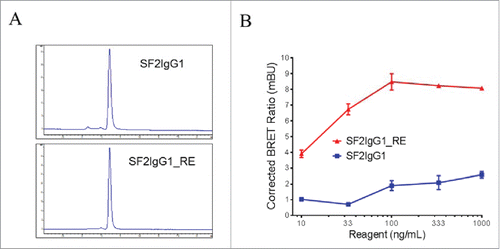
Figure 3. The effects of FcγRIIB crosslinking on the agonistic activities of engineered SF2 antibodies by HEK-Blue NF-κB reporter assay. (A) Increasing concentrations (10 ng/mL to 1000 ng/mL) of SF2IgG1_RE were incubated with HEK-Blue: OX40 cells with or without co-culturing with Raji cells. Another set of assays were set up in which Raji cells were pre-incubated with 5 μg/mL 2B6 antibody before co-culturing with HEK-Blue: OX40 cells to test the effect of blocking FcγRIIB-mediated crosslinking. Agonistic activities of the antibodies were assessed by the HEK-Blue NF-κB reporter assay. Agonistic activities of SF2 antibodies, normalized as percent activity relative to that driven by 1 μg/mL OX40 ligand, were plotted vs. the concentrations of test antibodies (Data expressed as mean ± SEM, n). (B) Similar assays were set up to study the effects of co-culturing with Raji cells on the agonistic activities of SF2IgG2σ_RE (Data expressed as mean ± SEM, n
).
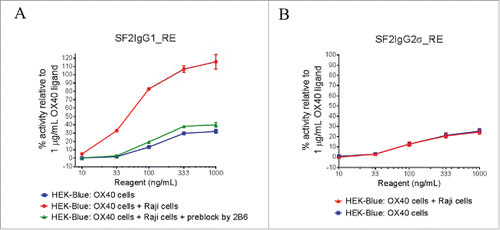
Figure 4. Effector functions of engineered SF2 antibodies. (A) ADCC activities of SF2 antibodies. Increasing concentrations (10 ng/mL to 1000 ng/mL) of SF2IgG1, SF2IgG1_RE, SF2IgG2σ and SF2IgG2σ_RE were incubated with HEK-Blue: OX40 cells co-cultured with effectors cells and the ADCC reporter bioassays were performed. Fold- activation of ADCC activities were plotted against the concentrations of test antibodies (Data expressed as mean ± SEM, n). (B) ADCP activities of SF2 antibodies. Increasing concentrations (1 ng/mL to1000 ng/mL) of SF2IgG1, SF2IgG1_RE, SF2IgG2σ and SF2IgG2σ_RE were incubated with GFP positive HEK-Blue: OX40 cells co-cultured with differentiated macrophages and the phagocytosis of GFP positive HEK-Blue: OX40 target cells were evaluated by flow cytometry assay. The percentages of GFP positive cells eliminated, which reflected the ADCP activities, were plotted vs. concentrations of test antibodies (Data expressed as mean ± SEM, n
). (C) CDC activities of SF2 antibodies. Increasing concentrations (10 ng/mL to10000 ng/mL) of SF2IgG1, SF2IgG1_RE, SF2IgG2σ and SF2IgG2σ_RE were incubated with HEK-Blue: OX40 cells in the presence of rabbit complement. CDC activities were quantitated by measuring lactate dehydrogenase (LDH) activity released from the cytosol of lysed HEK-Blue: OX40 cells, and expressed as percent cytotoxicity relative to that of cells lysed by Triton X-100 (Data expressed as mean ± SEM, n
).
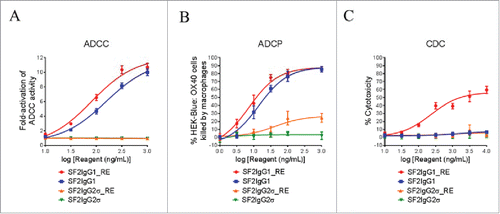
Figure 5. FcRn binding and pharmacokinetic analysis of engineered SF2 antibodies. (A) Competitive binding of SF2 antibodies to human FcRn at pH 6.0. Serially-diluted test antibodies were co-incubated at pH 6.0 with a constant concentration of biotinylated human IgG1 (biot-huIgG1) on a plate coated with human FcRn extracellular domain. Remaining bound biot-huIgG1 was detected with streptavidin-HRP developed with TMB substrate and read at 450 nm. (Data expressed as mean OD450 ± SEM, n = 2). (B) Pharmacokinetic analysis of SF2 antibodies in Tg32 SCID mice. Test antibodies were administered at an intravenous dose of 2 mg/kg, and serial retro-orbital bleeds were taken from each animal at indicated time points. PK profiles of each Ab were displayed as a semi-log plot serum concentration vs time. (Data expressed as mean ± SEM, n ).
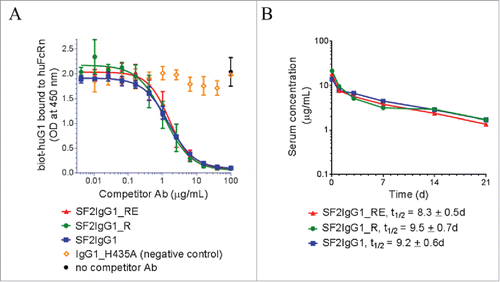
Table 1. Crystal and X-ray data and refinement statistics.
Figure 6. Association of Fc dimers and relative CH2 domain orientation within crystals of SF2IgG1_RE Fc. (A) Left panel shows a spiral of SF2IgG1_RE Fcs (cartoon) generated by application of the crystallographic symmetry operators to the Fc dimer (colored wheat and blue). Right panel shows a rotated view with projection down the 6-fold screw axis. (B) A prototypical wild-type IgG1 Fc structure (PDBid 3AVE, orange, ribbon) and wild-type IgG1 Fc crystallized under high salt conditions (PDBid 1H3Y, magenta, ribbon) were aligned to the crystal structure of SF2IgG1_RE Fc (blue, ribbon) based on the chain A CH2 domain. CH2 domains from both chains A and B are shown oriented looking down the pseudo 2-fold axis though the SF2IgG1_RE Fc CH3 dimer. CH3 domains are omitted for clarity. Dashed lines corresponding in color to Fc connect Cα atoms of residue R301 in opposing chains. Distances given in Ångstroms. (C) Fcs from PDBs 3AVE (orange) and 1H3Y (magenta) aligned to the bifurcated mannose residue (BMA, labeled with chain indicated in parentheses, bold) in the chain A glycan of the SF2IgG1_RE Fc structure (blue). The chain A glycan is shown in line for the latter structure only. Chain B glycans are shown in stick for all 3 Fc structures with select residues labeled.
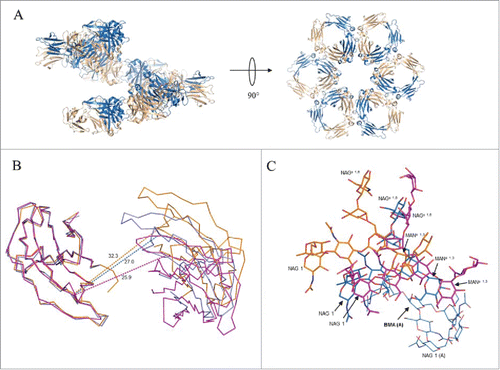
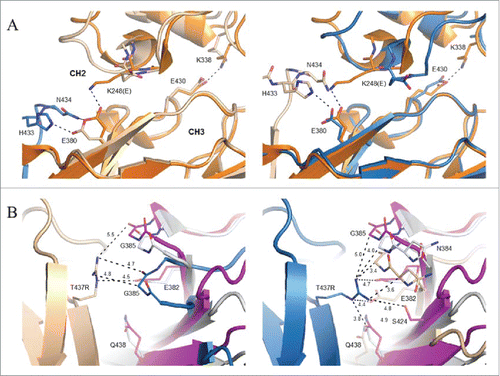
Figure 7. Local environment about K248E and T437R mutations in crystal structure of SF2IgG1_RE Fc. (A) Chain A of a prototypical wild-type IgG1 Fc (PDB 3AVE, orange, cartoon) shown for comparison aligned to the CH3 domain of chains A (left, wheat, cartoon) and B (right, blue, cartoon) from SF2IgG1_RE Fc. CH3 domain FG loop and G strand of a symmetry related SF2IgG1_RE Fc molecule shown in stick and cartoon and colored blue (left) or wheat (right). Select residues at the CH2:CH3 interface additionally shown in stick (labeled). Dashed lines indicate salt bridge or hydrogen bond interactions. CH2 and CH3 domains are labeled. (B) Inter-Fc interface about T437R (stick, labeled) in chains A (left, wheat cartoon) and B (right, blue cartoon) in crystal structure of SF2IgG1_RE Fc (wheat and blue). The equivalent interface for chains H and K from PDBid 1HZH were aligned to the CH3 domain of SF2IgG1_RE Fc chain A (left) or chain B (right), and the non-aligned interfacial CH3 domains are shown in gray and magenta cartoon. Residues within 5 Å of labeled T437R are shown in stick (labeled). Select distances given in Ångstroms.