3,589
Views
4
CrossRef citations to date
0
Altmetric
Report

Mammalian cell surface display for monoclonal antibody-based FACS selection of viral envelope proteins

, , , , , & show all
Pages 1052-1064 | Received 22 May 2017, Accepted 03 Aug 2017, Published online: 08 Sep 2017

Figures & data

Figure 1. Schematic overview of the flow cytometry-based panning procedure. Stable cell lines are generated by transfection of FlpIn™ T-REx™ 293 cells with pQL13-based Env constructs and the helper plasmid pOG44 carrying the integrase (1). Although multiple Env variants can theoretically enter the human cells and be expressed for a short period of time, a linkage of geno- and phenotype is ultimately achieved because FlpInTM T-RExTM 293 cells possess precisely one FRT site, resulting in single-integration stably transfected HEK293 cells (2). After induction of Env expression, the mammalian cell library is stained with the screening antibody (3), and then envelope-expressing cells yielding the highest or lowest signal to the applied antibody are selected via fluorescence-activated cell sorting (4). For analytical purposes, genomic DNA is recovered from the selected HEK293 cells, envelope genes are amplified by nested PCR, re-cloned into pQL13 and analyzed by qPCR or sequencing of plasmid DNA recovered from single E. coli clones. In the case of larger libraries, genomic DNA from sorted HEK293 cells can be directly subjected to NGS to calculate enrichment or depletion factors for the respective envelope variants. To further enhance enrichment rates, sorted HEK293 cells could be re-expanded to be subjected to a new round of panning.
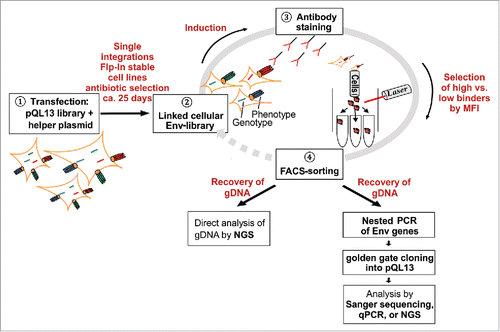
Figure 1. Schematic overview of the flow cytometry-based panning procedure. Stable cell lines are generated by transfection of FlpIn™ T-REx™ 293 cells with pQL13-based Env constructs and the helper plasmid pOG44 carrying the integrase (1). Although multiple Env variants can theoretically enter the human cells and be expressed for a short period of time, a linkage of geno- and phenotype is ultimately achieved because FlpInTM T-RExTM 293 cells possess precisely one FRT site, resulting in single-integration stably transfected HEK293 cells (2). After induction of Env expression, the mammalian cell library is stained with the screening antibody (3), and then envelope-expressing cells yielding the highest or lowest signal to the applied antibody are selected via fluorescence-activated cell sorting (4). For analytical purposes, genomic DNA is recovered from the selected HEK293 cells, envelope genes are amplified by nested PCR, re-cloned into pQL13 and analyzed by qPCR or sequencing of plasmid DNA recovered from single E. coli clones. In the case of larger libraries, genomic DNA from sorted HEK293 cells can be directly subjected to NGS to calculate enrichment or depletion factors for the respective envelope variants. To further enhance enrichment rates, sorted HEK293 cells could be re-expanded to be subjected to a new round of panning.

Figure 2. Schematic overview of the pQL13 vector system and the FlpIn™ T-REx™ stable cell lines.In pQL13, Env expression is linked to eGFP expression by a TaV 2A peptide. The eGFP-Env expression cassette is integrated into a distinct Flp Recombination Target (FRT) site within the FlpIn™ T-REx™ HEK293 cells, providing the hygromycin gene with a start-codon and hence resulting in the acquisition of a hygromycin resistance that can be used for selection of stable cell lines. Expression of eGFP and Env is under regulation of the Tet repressor (TR, T-REx™, red triangle) and thus inducible. The locations of the TaV 2A peptide, as well as the ATG leading to the acquisition of the hygromycin resistance, are highlighted in red. Note that the pQL13 vector graphic shows the horizontal map of the circular QL13 plasmid and that the FRT site (52 bp) and the Tet operator sequence (TO, 9 bp, clear diamond) are not in scale in this schematic. P: Promotor (SV40: simian virus 40, CMV: cytomegalovirus, BLA: β-lactamase), lacZ: β-galactosidase ORF, Amp: ampicillin ORF, Hyg: hygromycin ORF, ori: origin of replication, TR: Tet repressor protein, TaVp2A: TaV 2A peptide. Promotor positions are indicated by bent arrows.
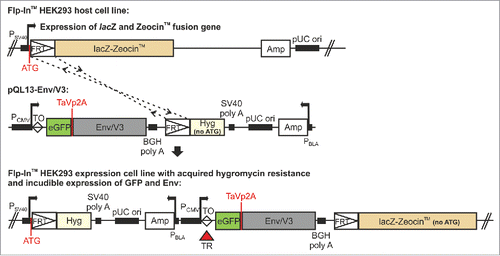
Figure 2. Schematic overview of the pQL13 vector system and the FlpIn™ T-REx™ stable cell lines.In pQL13, Env expression is linked to eGFP expression by a TaV 2A peptide. The eGFP-Env expression cassette is integrated into a distinct Flp Recombination Target (FRT) site within the FlpIn™ T-REx™ HEK293 cells, providing the hygromycin gene with a start-codon and hence resulting in the acquisition of a hygromycin resistance that can be used for selection of stable cell lines. Expression of eGFP and Env is under regulation of the Tet repressor (TR, T-REx™, red triangle) and thus inducible. The locations of the TaV 2A peptide, as well as the ATG leading to the acquisition of the hygromycin resistance, are highlighted in red. Note that the pQL13 vector graphic shows the horizontal map of the circular QL13 plasmid and that the FRT site (52 bp) and the Tet operator sequence (TO, 9 bp, clear diamond) are not in scale in this schematic. P: Promotor (SV40: simian virus 40, CMV: cytomegalovirus, BLA: β-lactamase), lacZ: β-galactosidase ORF, Amp: ampicillin ORF, Hyg: hygromycin ORF, ori: origin of replication, TR: Tet repressor protein, TaVp2A: TaV 2A peptide. Promotor positions are indicated by bent arrows.

Figure 3. TaqMan® Copy Number assay of stable cell lines. Stable cell lines were generated using either separate transfection of each of the pQL13-based Env/V3 chimeras or a mixture of all 5 Env/V3 chimeras for transfection (HEK293 cell library). Relative copy numbers of integrated pQL13 plasmids were explored using a TaqMan Copy Number Assay on 4 individual samples of genomic DNA of each cell line and probing for eGFP in relation to the human telomerase reverse transcriptase (TERT) genes, resulting in an integration rate of 1 for each human cell line (differences between the 6 stable cell lines statistically n.s., p > 0.05).
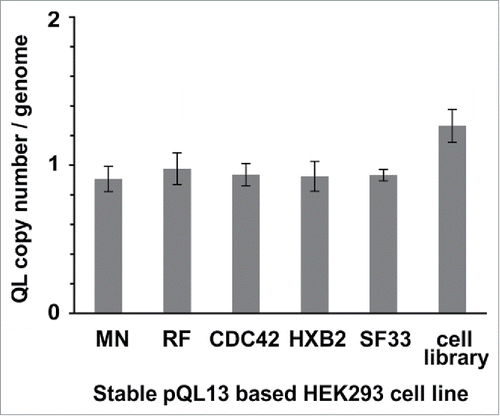
Figure 3. TaqMan® Copy Number assay of stable cell lines. Stable cell lines were generated using either separate transfection of each of the pQL13-based Env/V3 chimeras or a mixture of all 5 Env/V3 chimeras for transfection (HEK293 cell library). Relative copy numbers of integrated pQL13 plasmids were explored using a TaqMan Copy Number Assay on 4 individual samples of genomic DNA of each cell line and probing for eGFP in relation to the human telomerase reverse transcriptase (TERT) genes, resulting in an integration rate of 1 for each human cell line (differences between the 6 stable cell lines statistically n.s., p > 0.05).

Figure 4. Correlated expression of V3 envelope variants and eGFP. 3 × 10⁵ cells of each HEK293 stable cell line were induced with doxycycline (1 µg/ml) 24 h before flow cytometry analysis. The cells were harvested and stained with 5F3 and goat anti-human-APC as a secondary antibody. Measurements were performed in duplicates. 2.5 × 10⁴ cells were recorded per sample and the correlation between APC and GFP signal intensities was analyzed for each stable cell line (3000 events shown).
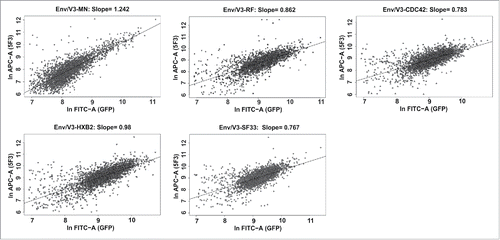
Figure 4. Correlated expression of V3 envelope variants and eGFP. 3 × 10⁵ cells of each HEK293 stable cell line were induced with doxycycline (1 µg/ml) 24 h before flow cytometry analysis. The cells were harvested and stained with 5F3 and goat anti-human-APC as a secondary antibody. Measurements were performed in duplicates. 2.5 × 10⁴ cells were recorded per sample and the correlation between APC and GFP signal intensities was analyzed for each stable cell line (3000 events shown).

Figure 5. Analysis of the affinities of 447–52D and HGN194 to the individual members of the Env/V3 model library. 24 h post induction of the Env/V3 stable HEK293 cell lines with doxycycline (1 µg/ml), these cells were stained with mAbs 447–52D or HGN194 until equilibrium binding was reached. Relative MFI values of bound antibodies in relation to the eGFP signal (MFI APC/ MFI eGFP) to normalize for Env expression levels are shown (mean values of 3 independent experiments). A and C: Relative MFIs (MFI APC/ MFI eGFP) of HEK293 cell lines stained with 2.7 nM 447–52D (A) and 6.7 nM HGN194 (C) (the same concentrations as used in all sorting experiments, see below) are shown to illustrate the individual binding pattern of the 5 Env/V3 chimeras to the respective antibody. B and D: flow cytometry titration using serial dilutions of 447–52D (B) and HGN194 (D).
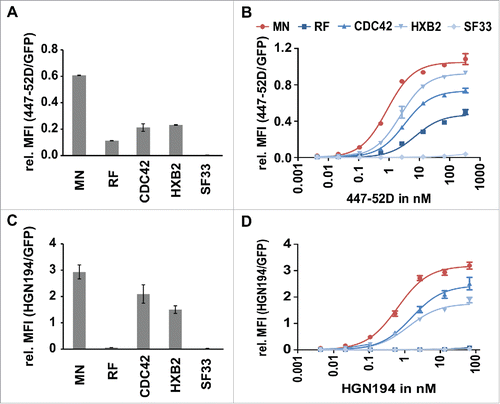
Figure 5. Analysis of the affinities of 447–52D and HGN194 to the individual members of the Env/V3 model library. 24 h post induction of the Env/V3 stable HEK293 cell lines with doxycycline (1 µg/ml), these cells were stained with mAbs 447–52D or HGN194 until equilibrium binding was reached. Relative MFI values of bound antibodies in relation to the eGFP signal (MFI APC/ MFI eGFP) to normalize for Env expression levels are shown (mean values of 3 independent experiments). A and C: Relative MFIs (MFI APC/ MFI eGFP) of HEK293 cell lines stained with 2.7 nM 447–52D (A) and 6.7 nM HGN194 (C) (the same concentrations as used in all sorting experiments, see below) are shown to illustrate the individual binding pattern of the 5 Env/V3 chimeras to the respective antibody. B and D: flow cytometry titration using serial dilutions of 447–52D (B) and HGN194 (D).

Figure 6. Flow cytometry-based panning using the Env/V3 model library stable cell line. A: A representative sorting experiment is shown to illustrate the flow cytometry-based cell sorting strategy (50,000 events). Living, single HEK293 cells were gated according to common hierarchical gating strategies. The remaining cells were then gated for highest APC signals (447–52D or HGN194 with anti-human-APC secondary antibody) in relation to eGFP signals (expression control). Thus, a triangular gate (gate P1) was chosen to select for high affinity binders. Similarly, P2 was chosen to select for low affinity binders to 447–52D and HGN194. B to E: The stable cell line pool containing the complete 5 member Env/V3 model library was used in a flow cytometry-based panning procedure 24 h after induction with doxycycline using 2.7 nM 447–52D (B, D) or 6.7 nM HGN194 (C, E). The envelope genes from the cell line pool prior (Input) and after selection (High Affinity P1 and Low Affinity P2) were PCR-amplified from the genomic DNA, cloned into pQL13, recovered from E. coli and analyzed by qPCR (B and C) or, alternatively, the gDNA of the HEK293 cells was directly subjected to NGS analysis (D and E). The mean values of 3 independent experiments are shown. The percentages of the variants in the input mixture and after one round of panning are given. Statistics were calculated using an unpaired t-test. Asterisks are indicated for *** p < 0.001, ** p < 0.01 and * p < 0.05.
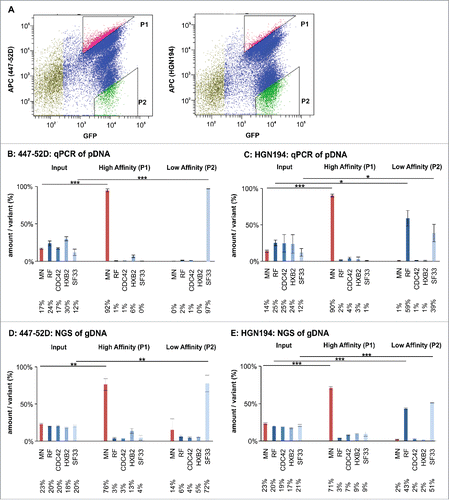
Figure 6. Flow cytometry-based panning using the Env/V3 model library stable cell line. A: A representative sorting experiment is shown to illustrate the flow cytometry-based cell sorting strategy (50,000 events). Living, single HEK293 cells were gated according to common hierarchical gating strategies. The remaining cells were then gated for highest APC signals (447–52D or HGN194 with anti-human-APC secondary antibody) in relation to eGFP signals (expression control). Thus, a triangular gate (gate P1) was chosen to select for high affinity binders. Similarly, P2 was chosen to select for low affinity binders to 447–52D and HGN194. B to E: The stable cell line pool containing the complete 5 member Env/V3 model library was used in a flow cytometry-based panning procedure 24 h after induction with doxycycline using 2.7 nM 447–52D (B, D) or 6.7 nM HGN194 (C, E). The envelope genes from the cell line pool prior (Input) and after selection (High Affinity P1 and Low Affinity P2) were PCR-amplified from the genomic DNA, cloned into pQL13, recovered from E. coli and analyzed by qPCR (B and C) or, alternatively, the gDNA of the HEK293 cells was directly subjected to NGS analysis (D and E). The mean values of 3 independent experiments are shown. The percentages of the variants in the input mixture and after one round of panning are given. Statistics were calculated using an unpaired t-test. Asterisks are indicated for *** p < 0.001, ** p < 0.01 and * p < 0.05.

Table 1. Specific enrichment rates of the Env/V3 variants selected from the fluorescence-activated cell sorting procedure after one round of panning.

Table 2. Comparison of apparent affinities of membrane-bound gp145 obtained from flow cytometry titration vs. soluble gp140 Env variants obtained from ELISA titration.

Supplemental material

supp_MAT_1364824.docx

Download MS Word (1.1 MB)