
Figures & data
Table 1. A comparison of the characteristics and roles of the reference medicinal product with that of a WHO international standard for mAb biological activity.
Figure 1. The roles of the WHO international standards (IS) and the reference medicinal product (RMP) in relation to the bioassay. The WHO IS supports bioassay performance and calibration. Bioassays are used as part of the comparability studies to demonstrate biosimilarity between the biosimilar product and the RMP.
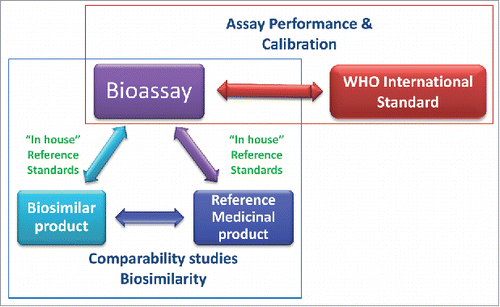
Table 2. Summary of the bioassays that contributed to the study.
Table 3. Individual laboratory relative potency estimates (geometric mean) for CDC assays.
Table 4. Individual laboratory relative potency estimates (geometric mean) for ADCC assays.
Table 5. Individual laboratory relative potency estimates (geometric mean) for cell-binding assays.
Table 6. Individual laboratory relative potency estimates (geometric mean) for apoptosis assays.
Table 7. Potency summary data relative to “in house” reference standards (IH Ref).
Figure 2. Summary bioassay data of geometric mean (GM) relative potency estimates using “in house” reference (IH Ref) or the candidate (sample A) as a standard. Boxes represent the interquartile range and the line shows the median. The bars represent the range and * shows outliers defined as 1.5 times the interquartile range.
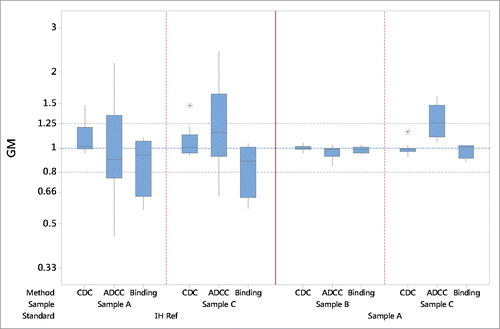
Table 8. Potency summary data relative to the candidate preparation.
Table 9. Accelerated degradation studies: Potency estimates for the candidate preparation stored at elevated temperatures for 10 months relative to ampoules stored at baseline temperature of −70 °C. The 95% upper and lower confidence limits are also shown.
Figure 3. Simulation of the potential impact of product drifting on mAb bioactivity over time. The Figures Show a hypothetical situation for 4 approved mAb products namely the innovator, a biosimilar 1 (BS-1), a biosimilar 2 (BS-2) and a biosimilar 3 (BS-3), in blue, green, red and purple respectively, with various post-approval changes and effects on mAb bioactivity. The x-axis represents time in years relative to the approval of the innovator product. The colored boxes represent the bioactivity range for the products for a given biological activity at the time of approval (darker shade) and post various manufacturing process changes (lighter shaded bars). Product specification at the time of approval is set in relation to the target product profile and is also noted in figures A-D and indicated by the dotted lines. The colored dotted rectangles in figures A and E indicate the biological activity range of the innovator product batches available and used as RMP during the comparability exercise for the three color-matching biosimilars. Figures A, B, C and D show biological activity relative to the proprietary “in house” reference standards (IH reference innovator, IH reference BS-1, IH reference BS-2 and IH reference BS-3) and figure E shows the bioactivity relative to the WHO IS. The innovator product batches used at the time of the biosimilarity assessment for different biosimilars have an impact on the target product profile and thus the characteristics of the approved biosimilar. Further, product drifting may occur for the 4 approved independent products upon post-marketing process changes. Currently in the absence of public higher order standards, those changes can only be characterized based on the comparison of a small number of available product batches post-change, available pre-change product batches, the proprietary “in house” reference standard and defined bioactivity specifications at the time of approval. Relative bioactivity changes between different approved products cannot be characterized in the absence of a common reference standard. The use of a WHO IS for the bioactivity of mAbs allows data harmonization and therefore a better understanding of potential product drift and evolution.
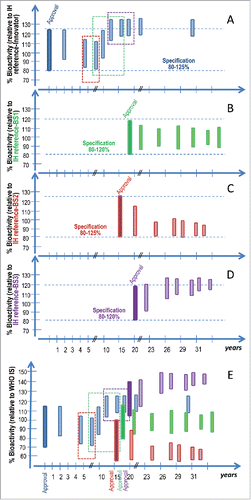
Table 10. Preparations used in the collaborative study.
Table 11. Fill production details of the preparations used in the collaborative study.
Table 12. List of participants in the collaborative study.