2,521
Views
38
CrossRef citations to date
0
Altmetric
Reports

Hydrogen/deuterium exchange mass spectrometry and computational modeling reveal a discontinuous epitope of an antibody/TL1A Interaction

, , , , , & show all
Pages 95-103 | Received 14 Aug 2017, Accepted 12 Oct 2017, Published online: 14 Nov 2017

Figures & data

Figure 1. HDX kinetics mapped onto TL1A trimer crystal structure (PDB code: 2RE9). The structure only represents the extracellular domain. Regions were colored from blue to red based on the extent of deuterium uptake (%).
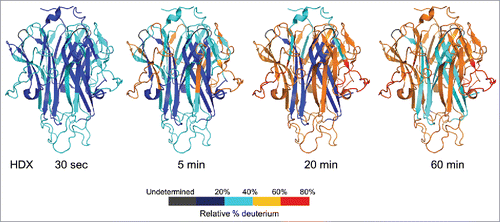
Figure 1. HDX kinetics mapped onto TL1A trimer crystal structure (PDB code: 2RE9). The structure only represents the extracellular domain. Regions were colored from blue to red based on the extent of deuterium uptake (%).

Figure 2. Differential HDX of TL1A upon (a) mAb1 binding and (b) Fab1 binding. Accumulated HDX reduction of peptic peptides across different exchange time periods: 30 sec (orange), 5 min (red), 20 min (light blue), 60 min (dark blue), and 240 min (black). The total levels of HDX reduction were color coded in three categories: D uptake difference 2.5–4.5 D (transparent green); D uptake difference 4.5–10 D (transparent yellow); D uptake difference >10 D (transparent red). (c) HDX kinetics curves of 85QVYAPLRADGDKPRAHL101, 102TVVRQTPTQHFKNQF116 and 166EIRQAGRPNKPDSIT180. TL1A upon mAb1 binding (blue) showed significant HDX reduction compared to TL1A alone (red). The non-deuterated peptide mass is shown in the upper left-hand corner of each plot.
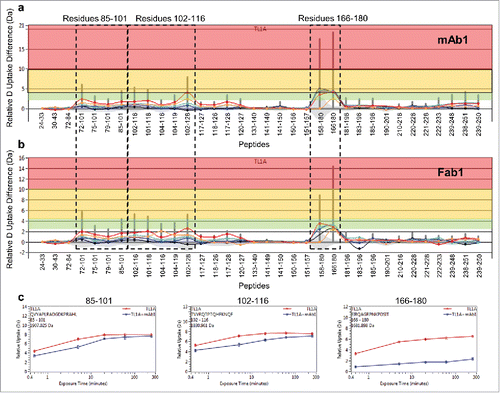
Figure 2. Differential HDX of TL1A upon (a) mAb1 binding and (b) Fab1 binding. Accumulated HDX reduction of peptic peptides across different exchange time periods: 30 sec (orange), 5 min (red), 20 min (light blue), 60 min (dark blue), and 240 min (black). The total levels of HDX reduction were color coded in three categories: D uptake difference 2.5–4.5 D (transparent green); D uptake difference 4.5–10 D (transparent yellow); D uptake difference >10 D (transparent red). (c) HDX kinetics curves of 85QVYAPLRADGDKPRAHL101, 102TVVRQTPTQHFKNQF116 and 166EIRQAGRPNKPDSIT180. TL1A upon mAb1 binding (blue) showed significant HDX reduction compared to TL1A alone (red). The non-deuterated peptide mass is shown in the upper left-hand corner of each plot.

Figure 3. HDX revealed two major epitope regions of mAb1, peptide 1 and peptide 2. (a) Epitope mapped onto the TL1A protein sequence. The TL1A construct is composed of the His-tagged isoleucine-zipper motif followed by the extracellular domain; (b) TL1A trimer crystal structure (PDB code: 2RE9); and (c) TL1A/DcR3 crystal structure (PDB code: 3K51).
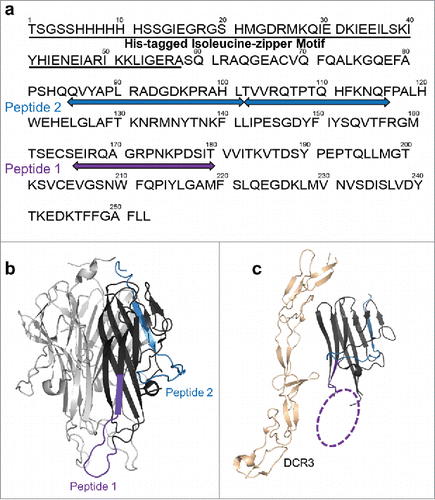
Figure 3. HDX revealed two major epitope regions of mAb1, peptide 1 and peptide 2. (a) Epitope mapped onto the TL1A protein sequence. The TL1A construct is composed of the His-tagged isoleucine-zipper motif followed by the extracellular domain; (b) TL1A trimer crystal structure (PDB code: 2RE9); and (c) TL1A/DcR3 crystal structure (PDB code: 3K51).

Table 1. Computational assessment of exposed amino acids corresponding to peptide region 1. Residues that are solvent exposed and prone to protein-protein interactions are considered functional residues.

Table 2. Computational assessment of exposed amino acids corresponding to peptide region 2. Residues that are solvent exposed and prone to protein-protein interactions are considered functional residues.

Figure 4. Molecular docking of TL1A with Fab. Epitope regions, peptide 1 and peptide 2, can contact CDR loops in VH and VL of Fab.
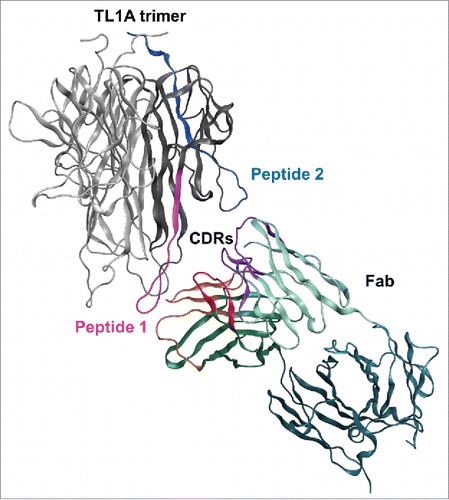
Figure 4. Molecular docking of TL1A with Fab. Epitope regions, peptide 1 and peptide 2, can contact CDR loops in VH and VL of Fab.

Figure 5. Deuterium uptake plots of ETD fragment ions between TL1A alone (black) and TL1A/Fab1 (dark red). (a) 102TVVRQTPTQHFKNQF116 and (b) 166EIRQAGRPNKPDSIT180. HDX-ETD was conducted in triplicate and the average deuterium uptake of each fragment ion was reported with standard deviation. The level of Fab1 binding-induced HDX reduction on each fragment ion was labeled in blue.
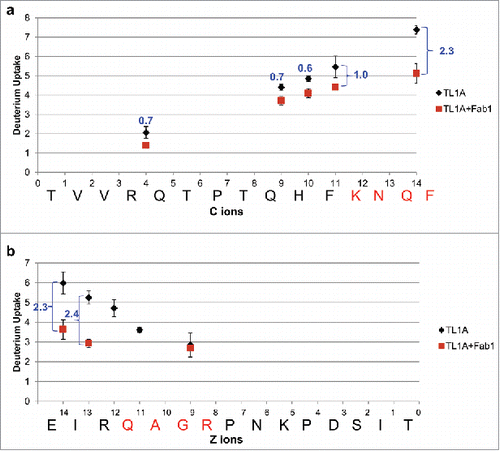
Figure 5. Deuterium uptake plots of ETD fragment ions between TL1A alone (black) and TL1A/Fab1 (dark red). (a) 102TVVRQTPTQHFKNQF116 and (b) 166EIRQAGRPNKPDSIT180. HDX-ETD was conducted in triplicate and the average deuterium uptake of each fragment ion was reported with standard deviation. The level of Fab1 binding-induced HDX reduction on each fragment ion was labeled in blue.

Figure 6. Residues in TL1A that are involved in mAb1 binding as determined by both HDX-ETD and computational modeling. (a) All residues are solvent exposed as shown in the TL1A monomer of its trimer crystal structure (PDB code: 2RE9). (b) A zoom-in view of the binding residues in peptide region 2 of TL1A in the TL1A/DcR3 crystal structure (PDB code: 3K51).
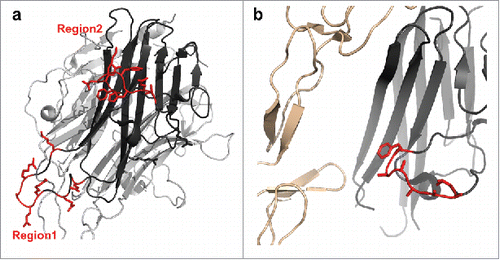
Figure 6. Residues in TL1A that are involved in mAb1 binding as determined by both HDX-ETD and computational modeling. (a) All residues are solvent exposed as shown in the TL1A monomer of its trimer crystal structure (PDB code: 2RE9). (b) A zoom-in view of the binding residues in peptide region 2 of TL1A in the TL1A/DcR3 crystal structure (PDB code: 3K51).
Supplemental material

Reprints and Corporate Permissions

Please note: Selecting permissions does not provide access to the full text of the article, please see our help page How do I view content?

To request a reprint or corporate permissions for this article, please click on the relevant link below:

Academic Permissions

Please note: Selecting permissions does not provide access to the full text of the article, please see our help page How do I view content?

Obtain permissions instantly via Rightslink by clicking on the button below:

If you are unable to obtain permissions via Rightslink, please complete and submit this Permissions form. For more information, please visit our Permissions help page.