
Figures & data
Table 1. Monoclonal antibodies in this study.
Figure 1. (a) 2-compartment PK model and (b) algorithm to test for linearity of PK data.
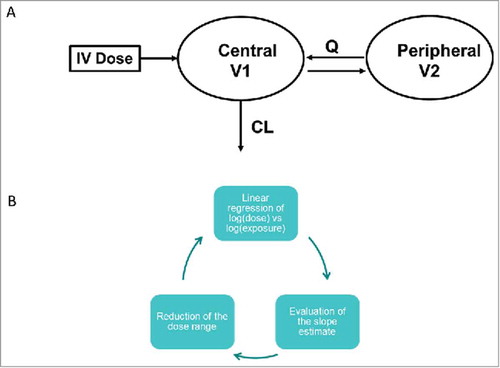
Table 2. Single species popPK parameter estimates for mAbs with linear CL.
Figure 2. Distribution of population and individual mAb estimates (with variability) of clearance (CL) in the combined human, cynomolgus monkey and hFcRn Tg32 mouse dataset.
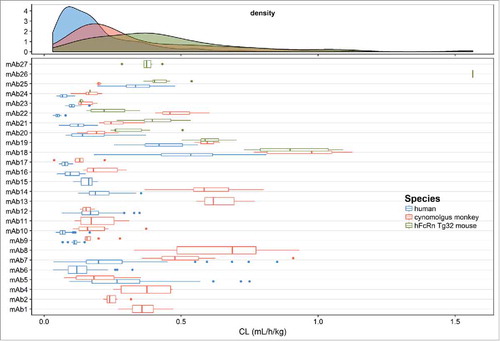
Figure 3. Distribution of population and individual mAb estimates (with variability) of volume of distribution of the central compartment (V1) in the combined human, cynomolgus monkey and hFcRn Tg32 mouse dataset.
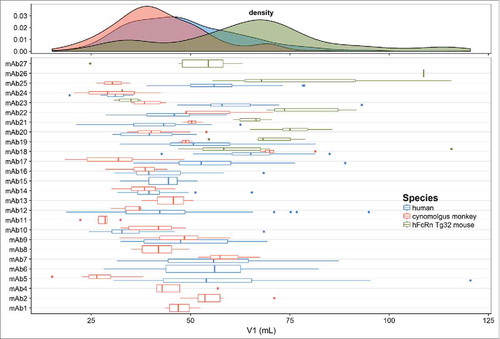
Table 3. Comparison of typical popPK parameter estimates in human with test set of clinical mAbs with linear PK.
Figure 4. Median, 5th and 95th percentiles of 200 bootstrap samples with the combined species PK model using the observed dose-normalized concentration (ng/mL) vs. time (hours) data for all of the mAbs in this study. The red lines indicate the concentration vs. time profile of the 5 clinical therapeutic mAbs (bevacisumab, infliximab (for both ankylosing spondylitis and ulcerative colitis), pertuzumab, rituximab and trastuzumab).
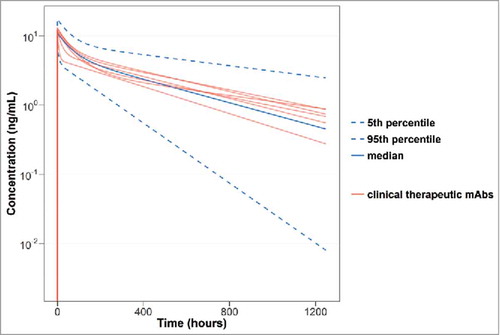
Figure 5. Clearance vs. AC-SINS score for a subset of 11 mAbs in the dataset in human, cynomolgus monkey and hFcRn Tg32 mouse.
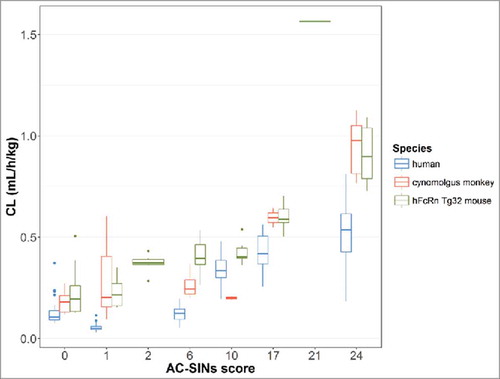
Table 4. Combined species PK parameter estimates for mAbs with linear CL.
Predicted human PK profiles using ‘typical’ human popPK parameter estimates (

 ).
).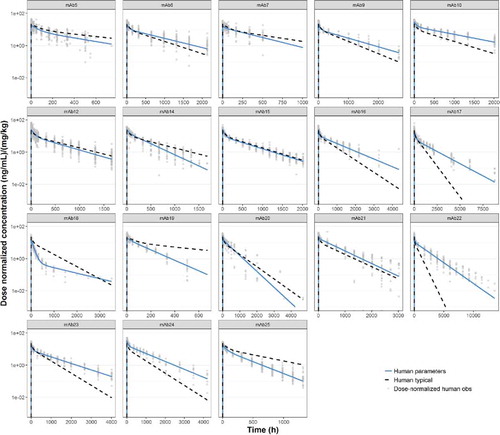
Comparison of observed human PK parameters for individual mAbs with ‘typical’ human popPK parameter estimates.
Figure 7. Predicted human PK profiles using (a) allometric exponents estimated for Tg32 mouse (

 ) and (c) ‘typical’ human popPK parameter estimates (
 ). Simulated data is compared with observed (individual) dose normalized human PK data (symbols) and profiles from fitting human data for individual mAbs (
 ).
).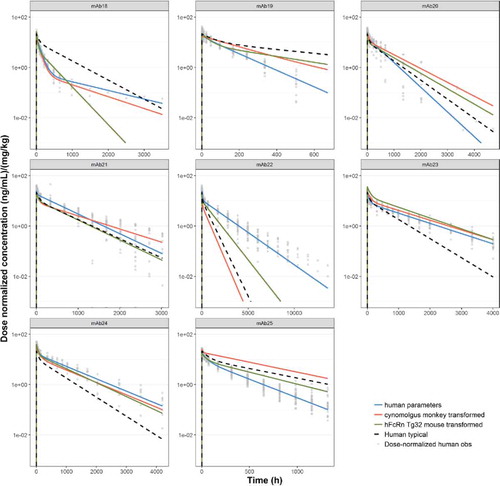
Table 6. Comparison of observed human PK parameters for individual mAbs and predicted human pharmacokinetic parameters determined by allometric scaling from hFcRnTg32 mouse.
Table 7. Comparison of observed human PK parameters for individual mAbs and predicted human pharmacokinetic parameters determined by allometric scaling from cynomolgus monkey.
Table 8. Comparison of model prediction RMSE (%) across different methods: use of human PopPK parameters, allometric scaling from Tg32 mouse and allometric scaling from cynomolgus monkey. The best prediction method (determined by lowest RMSE) is indicated for each mAb.