Figures & data
Figure 1. Synthesis of 6-AM-2-PCA and its application for N-terminal modification of peptides or proteins. (A) 6-AM-2-PCA is synthesized through azidization and subsequent oxidation of 6-(bromomethyl)-2-pyridinemethanol (1) to yield an azido intermediate (2) and ultimately, pyridinecarboxyaldehyde (3). (B) N-terminal modification of a protein with 6-AM-2-PCA results in an azide appended to the protein that orthogonally reacts with a DBCO derivative through the aldehyde-amine reaction.
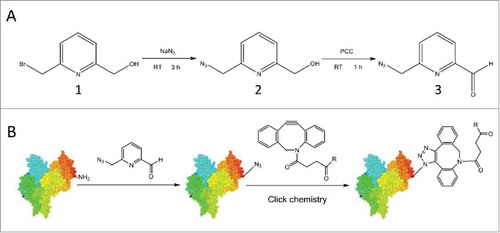
Figure 2. Fluorescence imaging of Fab and IgG antibodies modified by 6-AM-2-PCA. (A) Fab antibodies were treated with 6-AM-2-PCA, following by fixing to the membrane and incubation with DBCO-Seta650. Fluorescence signal was detected. (B) IgG antibodies were treated with 6-AM-2-PCA, following by fixing to the membrane and incubation with DBCO-Cy5.5. Fluorescence signal was detected. (C) IgG antibodies were treated with 6-AM-2-PCA, and sequentially labeled with DBCO-Cy5.5. The upper panel is the fluorescent imaging. The lower panel is Coomassie brilliant blue R-250 staining of proteins.
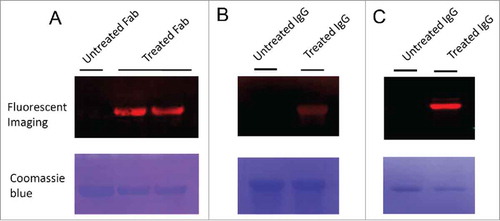
Figure 3. Site-specific attachment of 6-AM-2-PCA to ananti-Her2 antibody analyzed by Q Exactive MS. (A) Fab was reacted with small molecules and analyzed by LC/MS. A peak at 50359 Da (1) was assigned to unmodified Fab. The peaks at 50503 Da (2) and 50647 Da (3) are assigned to mono-modified and bis-modified Fab products, respectively, from the completed aldehyde-amine reaction. The peak at 50665 Da (4) represents a hemiaminal product for the aldehyde-amine reaction. Data are representative of two experimental observations. (B) Two mechanisms of the aldehyde-amine reaction.
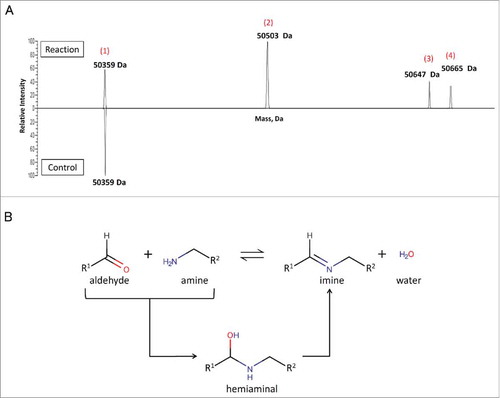
Table 1. Percent values of anti-Her2 Fab modified with 6-AM-2-PCA analyzed by MS.
Figure 4. Binding kinetic analysis of naive and modified anti-Her2 IgG antibodies to Her2 antigen. (A) Sensorgrams of binding kinetics. (B) Summary of binding rate constants and KD values. Experimental details are described in Materials and Methods.
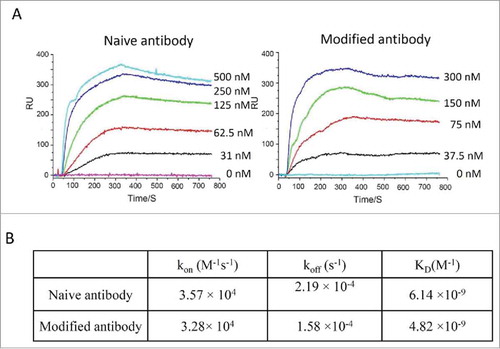
Figure 5. The stability of modified and unmodified antibodies in mouse plasma
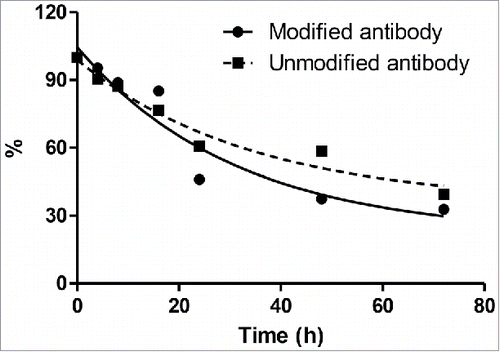
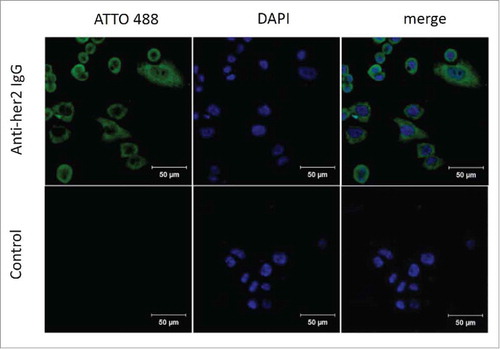
Figure 6. Immunostaining of SK-BR-3 breast cancer cells by 6-AM-2-PCA-conjugated anti-Her2 antibodies. (A) Three panels (left to right) represent fluorescence of SK-BR-3 cells stained with modified anti-Her2 Fab followed by DBCO-ATTO 488, nuclei stained with DPAI, and the mergedimage. (B) Three panels (left to right) represent fluorescence of SK-BR-3 cells stained with DBCO-ATTO 488 alone, nuclei stained with DPAI, and the merged image.