Figures & data
Figure 1. CD33 expression levels in monkey and human cells measured by flow cytometry. Data corresponding to human and monkey cells are shown in full and half-full circles, respectively. Horizontal bars show mean measured values.
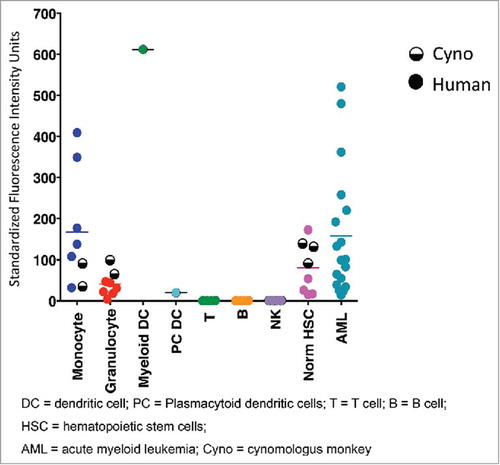
Table 1. Binding affinities of anti-CD33 mAb to human and cynomolgus monkey CD33 positive cells.
Figure 2. Characterization of anti-CD33 mAb binding to stable 293 HEK cells overexpressing recombinant human (red) and cynomolgus monkey (black) CD33. Incubations performed on ice for 30 min followed by detection with a goat-anti-human IgG-PE secondary reagent. Approximate EC50 for human and monkey are 0.60 µg/ml and 0.35 µg/ml, respectively.
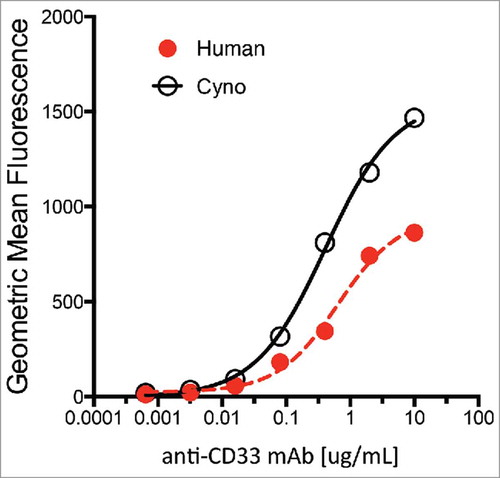
Table 2. Mean and standard deviation (SD) non-compartmental plasma PK parameters following administration of a 0.5 and 15 mg/kg IV bolus of anti-CD33 mAb to cynomolgus monkeys.
Figure 3. (a) Anti-CD33 mAb serum concentration following administration of a 0.5 mg/kg (in green) and 15 mg/kg (in blue) IV bolus of anti-CD33 mAb to cynomolgus monkeys. Symbols and bars represent mean and standard deviation, n = 3 unless indicated otherwise; missing values were below of the LLOQ of the assay (7.8 ng/mL). Solid lines correspond model fitted serum TAB curve using both PK and RO data sets. (b) Receptor availability/occupancy in granulocytes and monocytes following administration of a 0.5 mg/kg (in green) and 15 mg/kg (in blue) IV bolus of anti-CD33 mAb to cynomolgus monkeys. Symbols and bars represent mean and standard deviation (n = 3). Solid lines correspond fitted RO curve using both PK and RO data sets.
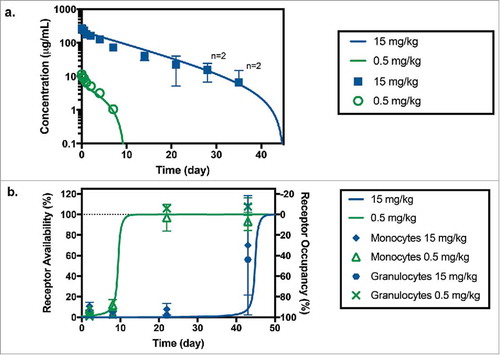
Figure 4. (a) Predicted and measured concentrations of TAB after administration of 0.1 mg/kg (n = 4), 0.2 mg/kg (n = 4), 0.4 mg/kg (n = 1) and 1 mg/kg (n = 1) of anti-CD33 ADC in toxicology study in cynomolgus monkey (LLOQ = 1 µg/mL). (b) Corresponding model predicted receptor availability/occupancy for the same study.
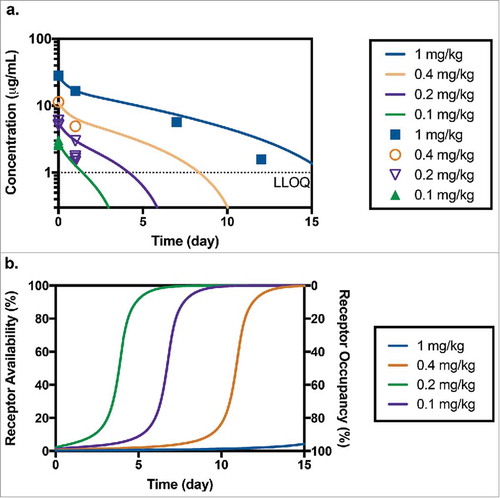
Table 3. Model parameters for the presented PK-RO model. The model was fitted to cynomolgus monkey data using both PK and RO data sets. Scaled-up parameters used for prediction for humans are also shown.
Table 4. Predicted human AUC0-t using the estimated parameters as well as the 5th and 95th percentile of the simulated distribution for doses of 0.25, 2.4 and 21 µg/kg. The maximum concentration (Cmax) and the predicted values of RO at Cmax are also reported.
Figure 5. (a) Predicted levels of receptor availability using the PK-RO model for lintuzumab for a range of Vmax values. Symbols and error bars correspond to the standard deviations as reported in Ref. Citation54. (b) Comparison of predicted clearance values a function of dose when the target capacity in humans is 1-fold (solid line), 3-fold (dashed line) and 10-fold (dotted line) the observed value of Vmax in cynomolgus monkey; symbols represent clinical data using AVE9633Citation 59 and GO.Citation 57 , Citation 58
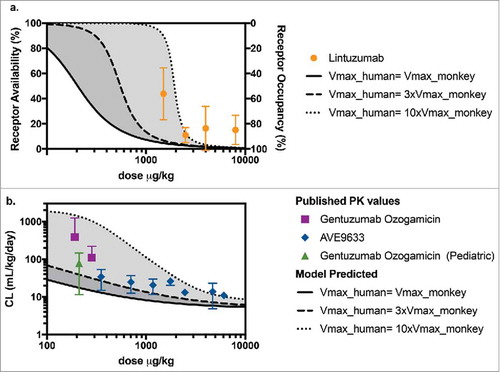
Figure 6. Model scheme used to describe PK-RO relationship in cynomolgus monkey and humans. The model consists of two compartments: central and peripheral. Drug concentrations are noted by C1 and C2 in the central and peripheral compartment, respectively. From the central compartment there are two main elimination mechanisms: non-specific (accounted by a CL term) and target mediated (represented by Vmax and KM). Receptor occupancy is related to concentrations by the Michaelis-Menten constant, KM.