Figures & data
Figure 1. Pharmacokinetic profiles from study 1. (a) Mean plasma concentration-time profiles of ALX-0171 and (b) ALX-0171 concentrations in epithelial lung lining fluid (ELF) after five consecutive daily administrations by inhalation to neonatal lambs. ALX-0171 concentrations in ELF were derived from concentrations measured in BALF, which was sampled postmortem, after normalization for dilution based on the Urea correction methodCitation 63 (values were red blood cell corrected). Bronchoalveolar lavage fluid (BALF) was sampled 24 hours after the last dose. Results are expressed as mean ± standard error for plasma curves and as individual lamb results with mean indicated as horizontal line for ELF. The hatched line represents the lower limit of quantification (LLOQ) of the assay. *ALX-0171 levels were below quantification limit for lamb N°10 from the 1 mg/kg dose group.
Figure 2. Pharmacokinetic profiles from studies 2, 3 and 4. (a) Mean plasma concentration-time profiles of ALX-0171 and (b) ALX-0171 concentrations in epithelial lung lining fluid (ELF) after three consecutive daily administrations by inhalation to neonatal lambs for studies 2, 3 and 4 combined. ALX-0171 concentrations in ELF were derived from concentrations measured in BALF, which was sampled postmortem, after normalization for dilution based on the Urea correction methodCitation 63 (values were red blood cell corrected). BALF was sampled 24 hours after the last dose. Plasma ALX-0171 concentrations that were below the lower limit of quantification were excluded from the analysis and the results are expressed as mean ± standard error. The hatched line represents the lower limit of quantifications (LLOQ) of the assays where LLOQ 1 is for the assay used in studies 2 and 3 and LLOQ 2 for the assay used in study 4. ALX-0171 concentrations in ELF are shown for each individual lamb with the mean indicated as horizontal line. In panel (a) Solid symbols are data from study 2, open symbols are from study 4. All 3 data points from study 2 – 0.3 mg/kg ALX-0171 dose gorup were <LLOQ1. All data points for study 3 – 0.04 mg/kg ALX-0171 dose were <LLOQ2.
Table 1. Summary of studies and groups.
Table 2. Lung viral loads in hRSV-infected neonatal lambs for the four performed studies.
Figure 3. Gross and microscopic scores of lungs from hRSV-infected lambs treated with either placebo or ALX-0171 from study 1. (a) Viral-related lung gross lesions were scored and percentage parenchymal involvement was estimated for each lung lobe. Mean percentage averages per lobe were calculated. Legend: Rt Cr = Right cranial lobe; Rt Mid = Right middle lobe; Rt Cd = Right caudal lobe; Acc = Accessory lobe; Lt Cr = Left cranial lobe; Lt Mid = Left middle lobe; Lt Cd = Left caudal lobe. (b) Microscopic (histopathologic) alveolar consolidation score was determined as percent area of RSV lesions followed by conversion to an integer-based consolidation scale as described in materials and methods section. (c) hRSV antigen expression in lung tissue was determined by counting the number of affected bronchi/bronchioles or alveoli per field. (d) Clinical severity scores for lambs in study 1. For each lamb, relative changes from baseline (day 0) in body-weights and respiratory rates were calculated for each day. The presence or absence of expiratory effort or wheeze at any day after start of treatment was recorded. Each of the parameters were given a score based on criteria as follows: If body weight increase between day 0 and day 6 >20% – score 0, if ≤ 20% – score 1; if blood oxygen saturation >92% on all days post treatment start – score 0, if blood oxygen saturation ≤92% at any day post-treatment start – score 1; if respiratory rates increase ≤10% at all days post-treatment start – score 0, if increase is between >10% and ≤25% at any day post treatment start – score 1, if increase is between >25% and ≤50% at any day post-treatment start – score 2, if increase is >50% at any day post-treatment start – score 3; if expiratory effort and/or wheeze are present at any day after treatment initiation a score of 0-3 is given for each parameter based on severity as described (Table S1 and 24). The clinical severity score was the sum of these individual scores with a maximum of 11. Results are expressed as mean ± standard error for panels (a) and (c); group averages with individual lamb scores are indicated by bullet points for panel (b) and median with range for panel (d).
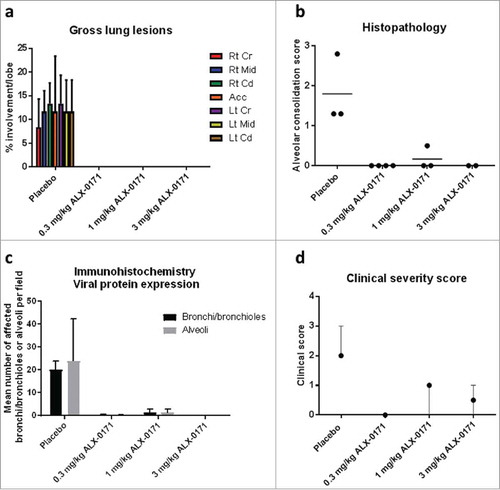
Figure 4. Gross and microscopic evaluation of lungs from hRSV-infected lambs treated with either placebo or ALX-0171 from study 2. (a) Viral-related lung gross lesions were scored and percentage parenchymal involvement was estimated for each lung lobe. Mean percentage averages per lobe were calculated. Legend: Rt Cr = Right cranial lobe; Rt Mid = Right middle lobe; Rt Cd = Right caudal lobe; Acc = Accessory lobe; Lt Cr = Left cranial lobe; Lt Mid = Left middle lobe; Lt Cd = Left caudal lobe. (b) Microscopic (histopathologic) alveolar consolidation score was determined as percent area of RSV lesions followed by conversion to an integer-based consolidation scale as described in materials and methods section. (c) hRSV antigen expression in lung tissue was determined by counting the number of affected bronchi/bronchioles or alveoli per field. (d) Lamb clinical severity scores. Clinical severity scores were calculated as described in . Results are expressed as mean ± standard error for panels (a) and (c); group averages with individual lamb scores are indicated by bullet points for panel (b) and median with range for panel (d).
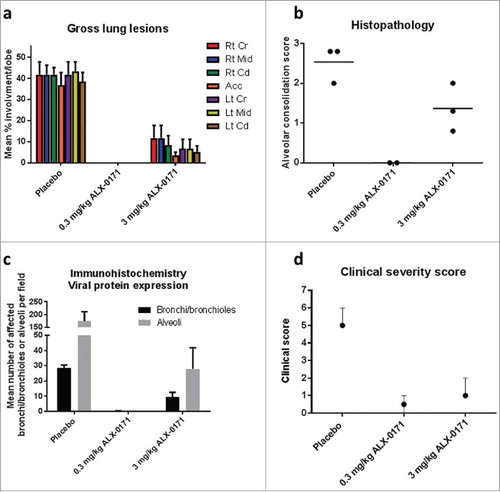
Figure 5. Gross and microscopic findings of lungs from mock-infected and hRSV-infected lambs treated with either placebo or ALX-0171 from study 3. (a) Viral-related lung gross lesions were scored and percentage parenchymal involvement was estimated for each lung lobe. Mean percentage averages per lobe were calculated. Legend: Rt Cr = Right cranial lobe; Rt Mid = Right middle lobe; Rt Cd = Right caudal lobe; Acc = Accessory lobe; Lt Cr = Left cranial lobe; Lt Mid = Left middle lobe; Lt Cd = Left caudal lobe. (b) Microscopic (histopathologic) alveolar consolidation score was determined as percent area of hRSV lesions followed by conversion to an integer-based consolidation scale as described in materials and methods section. (c) hRSV antigen expression in lung tissue was determined by counting the number of affected bronchi/bronchioles or alveoli per field. (d) Lamb severity clinical scores. Clinical severity scores were calculated as described in . Results are expressed as mean ± standard error for panels (a) and (c); group averages with individual lamb scores are indicated by bullet points for panel (b) and median with range for panel (d).
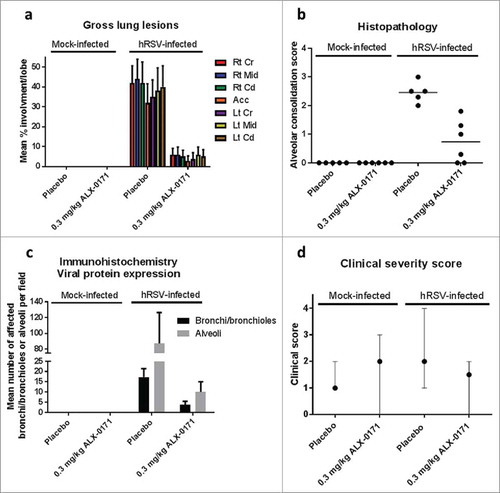
Figure 6. Lung pathology in mock-infected or hRSV-infected lambs treated with either placebo or ALX-0171 from study 3. (a) Images of lungs from mock-infected lambs (left column) and hRSV-infected lambs (right column). Lambs were either treated with placebo (top row) or ALX-0171 (bottom row) for 3 days consecutively. Images were taken at necropsy on day 6 post-infection. Lungs from lambs 27 (tag ID 4514), 38 (tag ID 4500), 33 (tag ID 4513) and 44 (tag ID 4504) are shown. Viral lesions are indicated with yellow arrows and are visible as plum-red lesions in lamb 38. (b) Microscopic (histopathologic) lung lesions of hRSV infected lambs. Microscopic lung images are from the same lamb lungs shown in . There was no microscopic lung lesions seen in the mock-infected placebo and ALX-0171-treated groups. The mock-infected placebo-treated group picture contains a normal bronchiole lacking lesions, while the mock-infected ALX-0171-treated group has a bronchus with surrounding cartilage (fat arrow) and also lacks lesions. The hRSV-infected placebo-treated group had a wide spectrum of lung lesions, with bronchitis characterized by the lumen which contains neutrophils (thin short arrow), sloughed epithelial cells (fat arrow), mucin (arrowhead), and red blood cells (long thin arrow). The hRSV-infected ALX-0171-treated group had significantly reduced histopathological lesions when compared to the mock-infected placebo and ALX-0171-treated groups, which was evident by the clear bronchi (circle), bronchioles (star) and alveolar spaces (diamond) present in the picture.
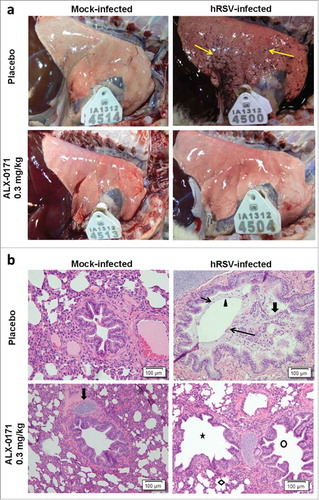
Figure 7. Scoring of general health status of hRSV-infected lambs treated with either placebo or ALX-0171. General health status was assessed daily until day 5 post-infection using the following scoring criteria: 0 – No clinical signs; 1 – Reluctant to move; 2 – Reluctant to move, head down, depressed, not interested in eating; 3 – Down, unwilling to get up or difficulty standing, not eating; 4 – Down and should be euthanized, probably cannot eat. Results are shown for each individual lamb and means are shown as bars.
Figure 8. Gross and microscopic findings of lungs from mock-infected and hRSV-infected lambs treated with either placebo or ALX-0171 from study 4. (a) Viral-related lung gross lesions were scored and percentage parenchymal involvement was estimated for each lung lobe. Mean percentage averages per lobe were calculated. Legend: Rt Cr = Right cranial lobe; Rt Mid = Right middle lobe; Rt Cd = Right caudal lobe; Acc = Accessory lobe; Lt Cr = Left cranial lobe; Lt Mid = Left middle lobe; Lt Cd = Left caudal lobe. (b) Microscopic (histopathologic) alveolar consolidation score was determined as percent area of hRSV lesions followed by conversion to an integer-based consolidation scale as described in materials and methods section. (c) hRSV antigen expression in lung tissue was determined by counting the number of affected bronchi/bronchioles or alveoli per field. Results are expressed as mean ± standard error for panels (a) and (c); group averages with individual lamb scores are indicated by bullet points for panel (b).
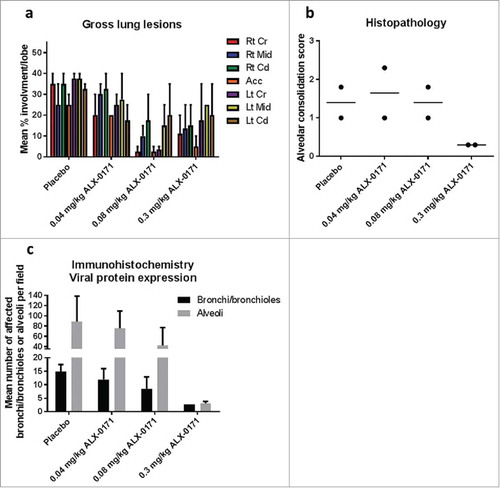
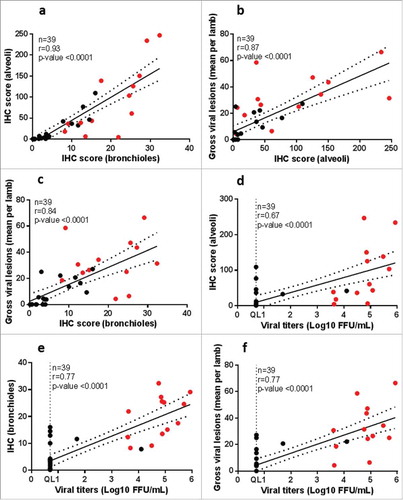
Figure 9. Correlation between independently scored readouts in hRSV – infected neonatal lambs. Correlation coefficient was calculated by Spearman's rank correlation test for the indicated parameters. Mock-infected lambs are excluded from the analysis. Black dots show the ALX-0171-treated lambs; red dots show the placebo-treated lambs. Dotted lines represent the 95% confidence bands. QL = Quantification limit; IHC = Immunohistochemistry.