Figures & data
Figure 1. Oxonium ions are generated after data-independent, all ion fragmentation (AIF) of glycopeptides during LC-MS/MS analysis, and are extracted from the MS/MS data to create profiles for comparing samples. An example mass spectrum (A.) and a zoomed-in version (B.) with illustrated structures of the HexNAc and sialic acid ions are shown.
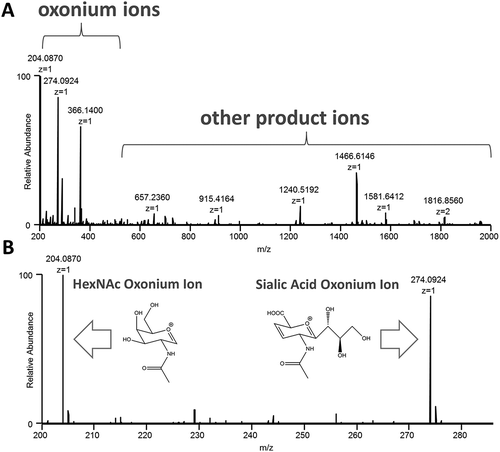
Figure 2. Experimental workflow of the oxonium ion profiling methodology. The spectrum at the bottom of the figure shows the extracted HexNAc oxonium fingerprint; however; other glycan oxonium ions can also be extracted such as that for sialic acid. The blue squares, green circles, and yellow diamonds represent HexNAc, Hex, and sialic acid sugars, respectively.
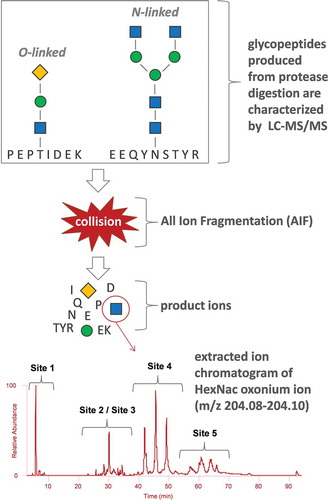
Figure 3. Rapid identification of Fab glycosylation in mAbs by HexNAc oxonium ion profiling. mAb1 (A.) only has Fc glycosylation; however, mAb2 has both Fc and Fab glycosylation. The proposed methodology can be utilized to assess the presence or absence of site-specific glycosylation.
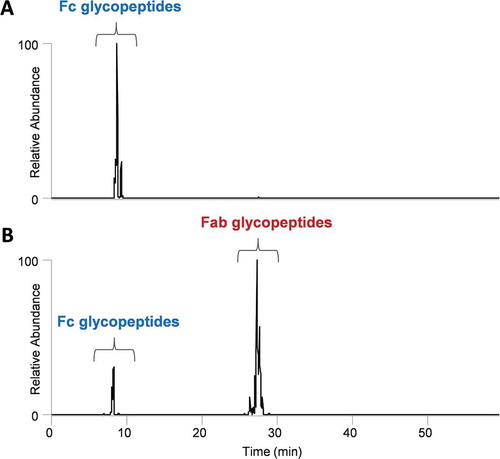
Figure 4. Comparison of the (A.) base peak chromatogram, (B.) HexNAc oxonium ion profile, and (C.) sialic acid oxonium ion profile of an Fc-Fusion1 reference sample. The blue square and yellow diamond represent HexNAc and sialic acid oxonium ions, respectively.
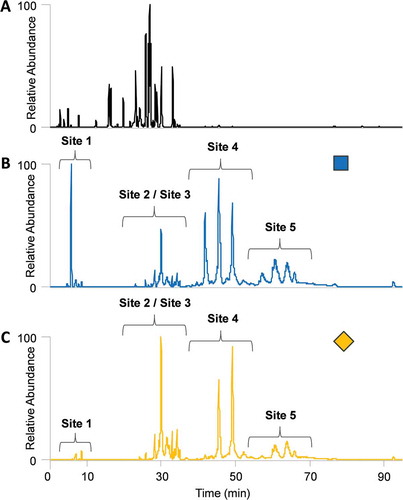
Figure 5. Site-specific HexNAc oxonium ion chromatograms of glycopeptide site 1 for (A.) Fc-Fusion1 reference, (B.) Clone_2, and (C.) Clone_4.Unknown glycopeptide species were detected in Clone_2 that were not detected by conventional analysis. Conversely, the Fc-Fusion1 reference and Clone_4 have similar oxonium profiles. Glycan nomenclature was as follows: HexNAc(#)Hex(#)Fuc(#)NeuAc(#)NeuGc(#).
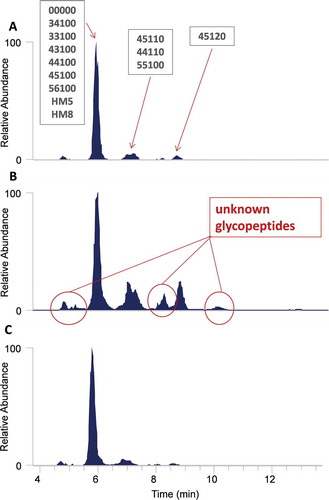
Figure 6. Overlaid (A.) HexNAc and (B.) sialic acid oxonium ion profiles of multiple Fc-Fusion1 reference and clone samples with LOESS smoothing and parametric time warping. The spectra illustrate significant differences in glycopeptide profiles between samples. All chromatograms were normalized to the maximum ion intensity.
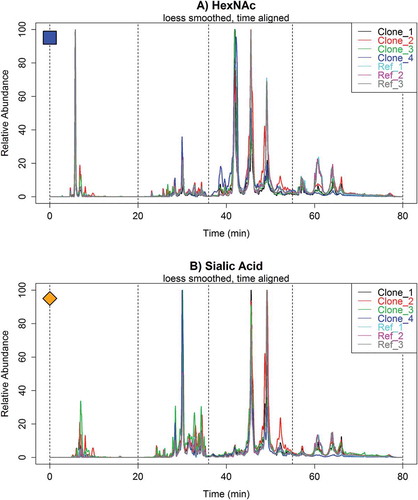
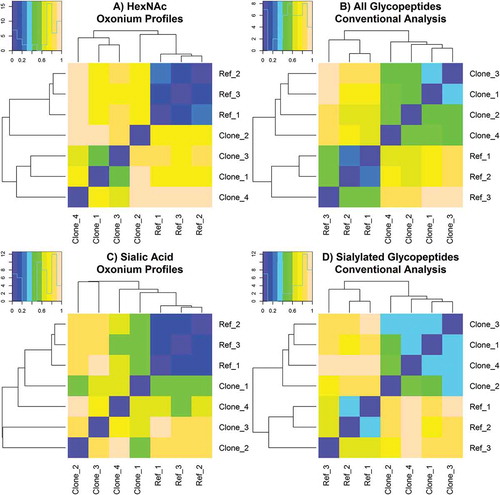
Figure 7. Automated similarity assessment of Fc-Fusion1 reference and clone samples calculated from (A.) processed HexNAc oxonium ion profiles, (B.) conventional analysis of all known and detected glycopeptides, (C.) processed sialic acid oxonium ion profiles, and (D.) conventional analysis of all known and detected sialic acid-containing glycopeptides. Samples with the most similarity and dissimilarity are purple colored and peach colored, respectively.