Figures & data
Table 1. Expression profile (% of the positive cells) of each target on human lymphocytes. Percentage of expression was calculated as an average of the fraction of human lymphocytes expressing each target from 8 different donors untreated or activated at different time intervals. Standard Deviations ≤ 10%.
Figure 1. Immunome screening. The screening procedure started from a universal cycle, common to the different targets, performed by panning the unselected library on activated PBMCs (inner circle). Each divergent circle sector describes the enrichment profiles for the best 10 scFv clones of the indicated targets, scored according to their counts per million values within the cycle 3. The lines within each sector connect the individual enrichments, obtained after cycle 2 (small circles) and cycle 3 (large circles). Cycles 2 and 3 were both performed on the recombinant proteins. The asterisks indicate the clones, successfully converted into stable IgG4s, which were further characterized in this work.
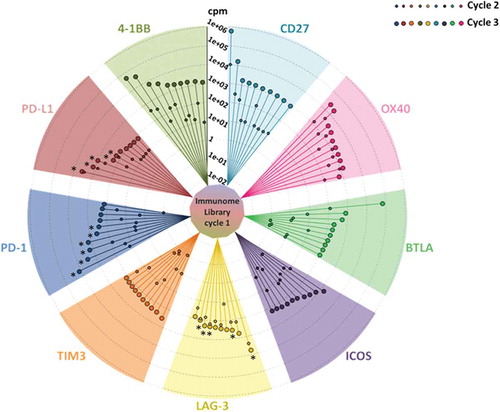
Figure 2. Trends of enrichments and phylogenetic correlations between the top 10 scFv clones, representative of each target. For each of the indicated targets, the left panel shows the representation of relative enrichments across the three selection cycles. The dendrograms shown at the right side report the phylogenetic clustering of the 10 most enriched scFv clones, according to the translated sequences of the corresponding hCDR3 regions.
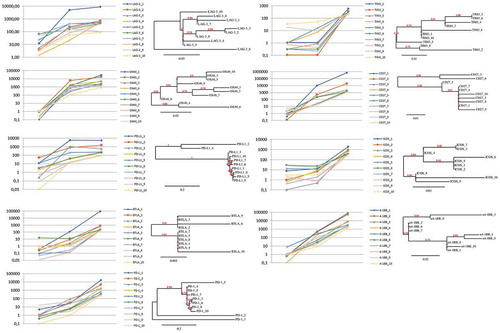
Figure 3. Binding of the selected antibodies to the purified recombinant proteins and tumor cells. Binding curves of the antibodies to each target protein/Fc (black curves) or Fc (grey curves) are reported in the left and central panels. The binding curves of the anti-PD-L1 mAbs to MDA-MB231 cells (black curves) or MCF-7 cells (grey curves) are reported in the right panel. The Kd values obtained from the binding curves of the antibodies to each target protein/Fc, activated hPBMCs and tumor cells are reported in the table. Binding values were reported as the mean of at least three determinations obtained in three independent experiments. Error bars depicted means ± SD. P values for the binding of the indicated mAbs to each target protein/Fc relative to their binding to Fc: ***P ≤ 0.001; **P < 0.01.
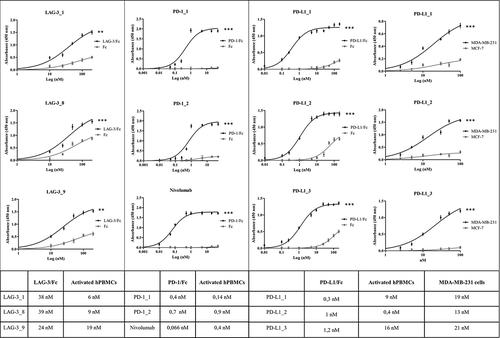
Figure 4. Effects of the novel antibodies on lymphocyte proliferation. A. Proliferation of hPBMCs after stimulation with PHA at 2.5 μg/mL in the absence or in the presence of the immunomodulatory antibodies. Fold increase of CD3+ T cell proliferation determined by the indicated selected antibodies was measured by anti-CD3 staining by FACS with respect to activation of hPBMCs with PHA at 2.5 μg/mL in the absence of antibodies or in the presence of an unrelated IgG4. B. Effects of anti-PD-L1 antibodies on Lymphocyte proliferation as induced by tumor cells. Fold increase of hPBMCs proliferation as determined by normalized absorbance values obtained by ELISA with anti-BrdU antibodies in hPBMCs samples co-cultured with MDA-MB-231 (left panel) or MCF-7 (right panel) tumor cells in the absence (white bar) or in the presence of increasing concentrations (50 nM and 200 nM) of PD-L1_1 (light grey bars) or PD-1_1 (grey bars) antibodies for 72 hours at 37°C. Nivolumab was used, in both the experiments, as a positive control (black bars). Concentration values were reported as the mean at least three determinations in five independent experiments performed by using lymphocytes from 5–8 healthy donors. Error bars depicted means ± SD. P values for the indicated mAbs relative to unrelated IgG4 are: ***P ≤ 0.001; **P < 0.01; *P < 0.05.
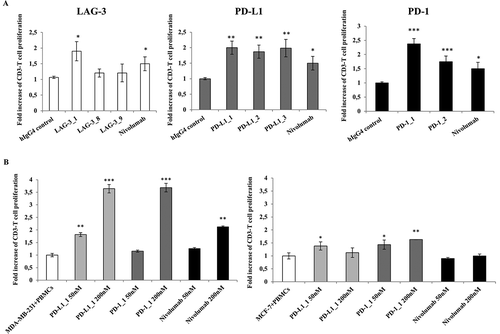
Figure 5. Effects of the novel immunomodulatory antibodies on secretion of cytokines by stimulated T cells. IL-2 and IFNγ values obtained by ELISA assays on supernatants of hPBMCs stimulated with PHA (2.5 μg/mL) or SEB (50 ng/mL) in the absence or in the presence of the antibodies LAG-3_1, PD-1_1, PD-1_2, PD-L1_1, PD-L1_2 for 18–66 hours at 37°C. Nivolumab, atezolizumab and an unrelated antibody were used as a positive and negative control, respectively. Concentration values were reported as the mean at least three determinations in five independent experiments performed by using lymphocytes from 5–8 healthy donors. Error bars depicted means ± SD. P value for the indicated mAbs relative to unrelated IgG4 is: ***P ≤ 0.001.
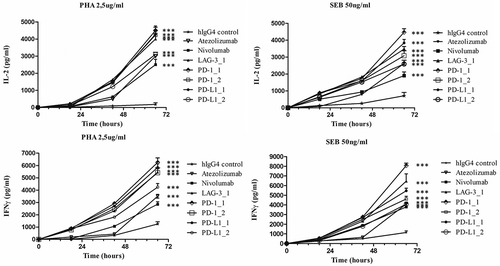
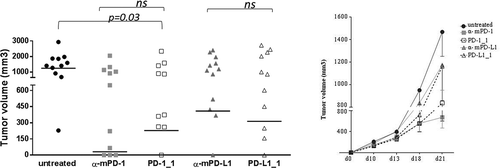
Figure 6. In vivo antitumor activities of PD-1_1 and PD-L1_1 antibodies. Tumor growth in groups of 10–12 mice inoculated with CT26 cells at day 0 and treated with PD-1_1, PD-L1_1 or positive control antibodies reacting against murine PD-1 and PD-L1 (α-mPD-1, α-mPD-L1) at day 3, 6 and 10. Shown is tumor volume for individual mice at day 21 (left) and mean of tumor volume for each group over time (right panel).