Figures & data
Figure 1. Establishment of T-DM1-resistant cells from JIMT1 cell line. (A) Procedures and the time line for developing and establishing T-DM1-resistant (T-DM1R) cells. (B) Cell growth files of T-DM1R and parental JIMT1 cells in 10% FBS-containing media with or without of T-DM1 4.0 μg/ml. (C) Cell growth files of T-DM1R and parental JIMT1 cells in 1% FBS-containing media with or without of T-DM1 4.0 μg/ml. (D) Soft agar assay in the presence of 10% FBS. Scale bar, 50 µm. (E) Quantification of soft agar assay. Colonies that were larger than 50 µm in diameter were counted. (F) Fluorescent immunostaining images showing polymerized microtubule and actin in T-DM1R cells, comparing with those in the parental cells in the absence/presence of 4 µg/ml T-DM1. Nucleus was stained with DAPI. Scale bar, 20 µm. (G) Fluorescent immunostaining images showing polymerized microtubule and separated chromosome in T-DM1R cells during cell mitosis, comparing with those in the parental cells in the absence/presence of 4 µg/ml T-DM1. Chromosome was stained with DAPI. Scale bar, 10 µm.
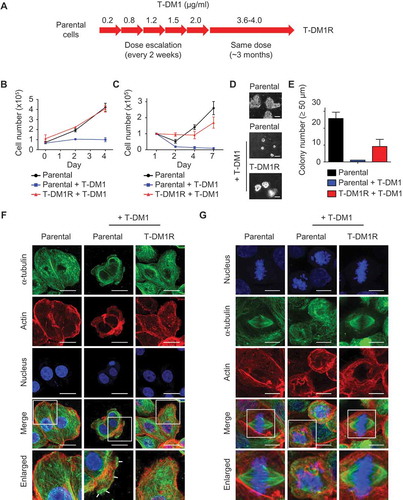
Figure 2. HER2-dependent T-DM1 internalization is blocked in T-DM1R cells. (A) The levels of endogenous HER2 in the WCL of JIMT1 parental and T-DM1R cells were analyzed by Western blot. (B) Fluorescent immunostaining images showing HER2 in JIMT1 parental and T-DM1R cells. Nucleus was stained with DAPI. Scale bar, 20 µm. (C and D) JIMT1 parental cells were incubated with 100 µg/ml T-DM1 at 37°C for 1 hr and 6 hrs, and subsequently fixed for fluorescent immunostaining of T-DM1 using DyLight 488-conjugated anti-human IgG antibody (green in C and D), HER2 (red in C) and LAMP-1 (red in D). Nucleus was stained with DAPI (blue in C and D). Scale bar, 20 µm. (E and F) JIMT1 T-DM1R cells were incubated with 100 µg/ml T-DM1 at 37°C for 1 hr and 6 hrs, and subsequently fixed for fluorescent immunostaining of T-DM1 using DyLight 488-conjugated anti-human IgG antibody (green in E and F), HER2 (red in E) and LAMP-1 (red in F). Nucleus was stained with DAPI (blue). T-DM1 were not co-localized with either HER2 or LAMP-1. Scale bar, 20 µm.
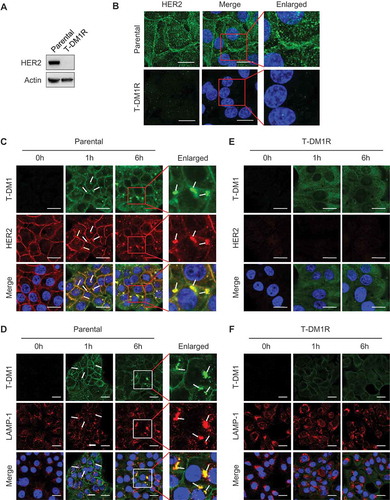
Figure 3. Cell migration and invasion activities are promoted in T-DM1R cells. (A) Bright field (BF) images of JIMT1 parental and T-DM1R cells. Scale bar, 50 µm. (B) Cell migration assay. Scale bar, 100 µm. BF images of Day 0 and Day 1 are shown for each experiment. (C) Actin staining by rhodamine phalloidin shows invadopodia-like actin protrusion in T-DM1R cells. Scale bar, 10 µm. (D) Quantification of invadopodia-like actin protrusion positive cells in parental and T-DM1R cells. Cell numbers showing invadopodia-like actin protrusion positive cells were quantified per total cell numbers counted in randomly selected fields (n = 3, total 118–370 cells). (E) Cell invasion activity was measured by obtaining relative fluorescence units (RFU) from cells that passively passed through ECM-coated membrane (see Materials & Methods in detail) .
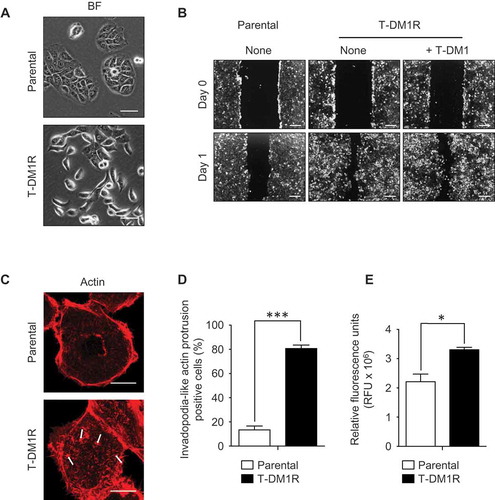
Figure 4. α5β1 integrin is up-regulated in T-DM1R cells and blocking α5β1 integrin enhances cell invasion activity. (A) Gene expression levels of α5 integrin and β1 integrin were examined by quantitative PCR. GAPDH gene was used as an internal control. (B) Protein expression levels of α5 and β1 integrins in the WCL of JIMT1 parental and T-DM1R cells were analyzed by Western blot analysis. (C) Fluorescent immunostaining images showing α5 integrin and vinculin in JIMT1 parental and T-DM1R cells. Scale bar, 20 µm. (D) Fluorescent immunostaining images showing β1 integrin and paxillin in JIMT1 parental and T-DM1R cells. Scale bar, 20 µm. (E) Knock-down efficiency of β1 integrin in T-DM1R cells was evaluated by Western blot analysis. (F) Bright field (BF) images showing cell morphology of control siRNA and β1 integrin specific siRNA treated T-DM1R cells. BF images, scale bar, 50 µm. (G) Cell invasion activity in control siRNA treated or β1 integrin knocked-down T-DM1R cells. (H) Cell growth assay in control siRNA and β1 integrin knocked-downed T-DM1R cells after 48 hrs of siRNA transfection. (I) BF images showing the number of MAB 13-treated HT1080 or T-DM1R cells that passed through ECM-coated membrane. Scale bar, 100 µm. (J) Quantitative analysis of cell invasion activity in MAB 13-treated T-DM1R cells comparing with that in PBS control cells.
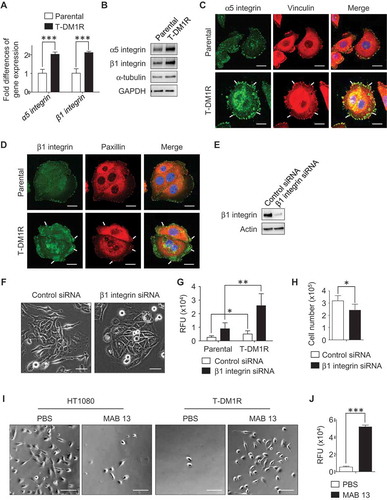
Figure 5. αV integrin is involved in the enhancement of cell invasion activity in β1 integrin gene knocked-down or function-blocked T-DM1R cells. (A) The levels of αV integrin expression were examined in WCL of parental and T-DM1R cells in the absence/presence of 4 µg/ml T-DM1 by Western blot analysis. (B) The levels of αV integrin expression were examined in WCL of control IgG or MAB 13-treated T-DM1R cells for 48 hrs by Western blot analysis. (C) α5 integrin, β1 integrin and αV integrin protein expressions were evaluated on Western blot analysis after knocking down of β1 integrin, αV integrin or both β1 and αV integrins in T-DM1R cells. (D) Bright field (BF) images showing invasive T-DM1R cells that passed through the ECM-coated membrane. Images represent T-DM1R cells treated with control siRNA, β1 integrin siRNA, αV integrin siRNA, or β1 and αV integrin siRNAs. Scale bar, 100 µm. (E) Quantitative analysis of cell invasion assays. (F) BF images showing invasive T-DM1R cells that passed through the ECM-coated membrane. Images represent T-DM1R cells treated with control IgG + control siRNA, MAB 13 + control siRNA, control IgG + αV integrin siRNA, or MAB 13 + αV integrin siRNAs. Scale bar, 100 µm. (G) Quantitative analysis of cell invasion activity. (H) BF images showing invasive T-DM1R cells that passed through the ECM-coated membrane. Images represent T-DM1R cells treated with control IgG, MAB 13, control IgG + RGD peptide, or MAB 13 + RGD peptide. Scale bar, 100 µm. (I) Quantitative analysis of cell invasion activity.
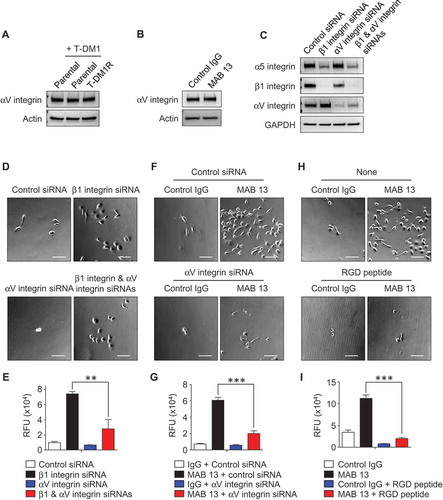
Figure 6. The enhanced EGFR activity functionally cooperates with integrins and regulates T-DM1R cell invasion and growth. (A) Images showing the levels of phosphorylated receptor tyrosine kinases (RTKs) in parental cells treated as indicated or T-DM1R cells. (B) The levels of EGFR and phosphorylated EGFR were evaluated in the WCL of parental and T-DM1R cells by Western blot analysis. (C) Cell invasion activities of T-MD1R cells treated with different specific siRNAs or drugs as indicated. The concentration of cetuximab was 100 µg/ml cetuximab, and concentration of erlotinib was 5 µM. (D) The levels of αV integrin, β3 integrin and EGFR were evaluated in WCL of T-DM1 cells treated with either control siRNA or β1 integrin siRNA using Western blot analysis (left panels). WCL of T-DM1 cells treated as indicated were subjected to co-immunoprecipitation experiments (right panels), and Western blot data showed that β3 integrin, but not EGFR, was detected in anti-αV integrin immunoprecipitates. (E) 1 × 10⁶ JIMT1 parental or T-DM1R cells were seeded on fibronectin-coated 6-well plates and cultured overnight. Then, T-DM1R cells were treated with 5 µM erlotinib or left untreated and cultured for another 24 hrs. Bright field images were captured at 24-hour time point. Scale bar, 50 µm. (F) The levels of α5, β1 and αV integrin expressions were evaluated by Western blot analysis in the WCL collected at 24 and 48-hour time points as shown in E. (G) Cell growth profiles of JIMT1 parental or T-DM1R cells treated with either 5 µM erlotinib or DMSO control, respectively. T-DM1R cells were always cultured in the media containing 4 μg/ml of T-DM1. (H) Cell invasion activities of T-DM1R cells treated with 5 µM erlotinib, 5 µM AG1478 or DMSO control.
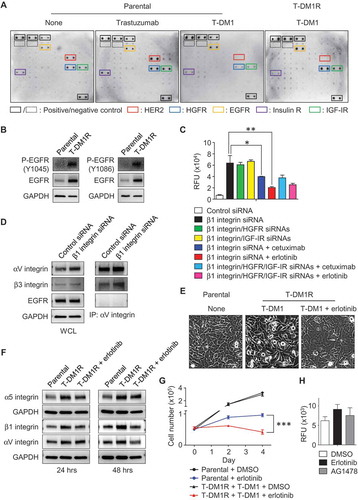
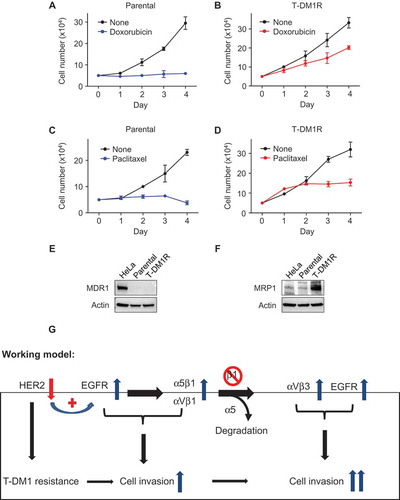
Figure 7. Cross-resistance of T-DM1-resistant cells to doxorubicin and paclitaxel. (A, B) Cell growth profiles of JIMT1 parental or T-DM1R cells treated with either 50 nM doxorubicin or left untreated. T-DM1R cells were cultured in the media containing 4 μg/ml of T-DM1. (C, D) Cell growth profiles of JIMT1 parental or T-DM1R cells treated with either 5 nM paclitaxel or left untreated. T-DM1R cells were cultured in the media containing 4 μg/ml of T-DM1. (E and F) The levels of MDR1 were evaluated in the WCL of parental and T-DM1R cells by Western blot analysis using anti-MDR1 antibody. HeLa cells were used as a positive control. The experimental procedure for Figure 7F is essentially the same as described in Figure 7E, except that anti-MRP1 antibody was used to detect the protein levels of MRP1 in WCL. (G) Working model: Loss of HER2 confers T-DM1 resistance in HER2-positive breast cancer cells, which in turn upregulates EGFR via a compensatory mechanism. Increased EGFR activity changes the expression of the major RGD integrins, α5β1 and αVβ1, leading to the enhanced cell invasion compared with parental JIMT1 breast cancer cells. Importantly, when β1 integrin function is blocked by either specific siRNA or inhibitory monoclonal antibody, MAB 13, this leads to significant increase in cell invasion of T-DM1R cells.