Figures & data
Figure 1. Experimental setup of both hardware and communication of coupling light scattering with purification system.
a). The MALS detector was connected in-line, downstream of the purification unit. HIC purified samples were also sampled downstream of the in-line MALS by on-line UHPLC. On-line UHP-SEC-µMALS served as another application to monitor the fraction and molar mass of aggregates. The samples were separated by analytical SEC and evaluated using a UHP-SEC capable multi-angle light scattering detector (µMALS) and UV signal of the on-line UHPLC as the concentration source. b) The start or inject signal and the UV signal from the purification unit were sent to the in-line MALS via an I/O Box. The UV signal of the purification unit was the concentration source used to calculate Mw of the protein eluted from the HIC column. Real time molecular weight and start/stop trigger signals were sent by the in-line MALS detector to the purification system (via a voltage signal) for fractionation when the measured Mw fell between preset Mw ranges.
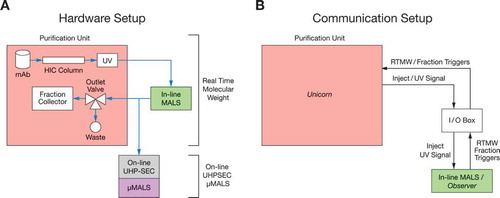
Figure 2. Real time MALS data from a HIC purification.
a). The concentration and Mw signals are plotted along with the trigger signals. Throughout the purification, there is an increase in Mw (—) as aggregates saturate the HIC column and dimers coelute with the monomers. The protein is eluted from the column and passes through both the UV and in-line MALS detectors. The Mw is calculated in < 1 s using both the UV and light scattering signal and a start/stop trigger (- - -) is sent to the purification unit when the protein meets the preset Mw criteria. The concentration is calculated from the UV detector of the purification unit (---). b) No significant differences were observed between the data from real time (—) and post processed modes of analysis (---).
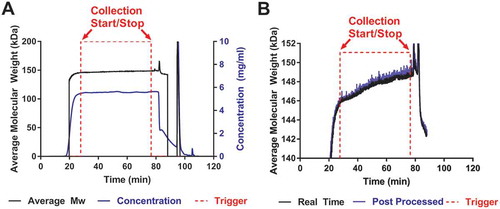
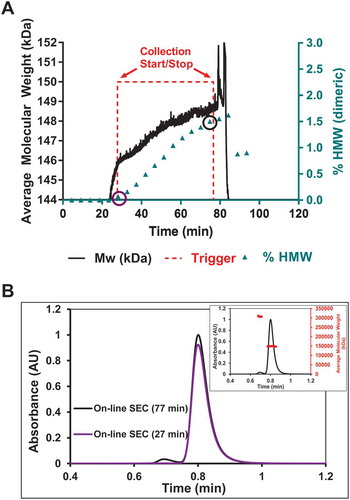
Figure 3. On-line UHP-SEC-µMALS data correlates well with the real time Mw data from in-line MALS.
a) Real time molecular weight (—) shown previously is rescaled to show the increase in Mw of ~ 2750 Da. The HMW content (▲) increases by 1.5% over the course of the purification as determined by on-line UHP-SEC-µMALS. b) On-line UHP-SEC chromatograms of the samples at the start and stop trigger points showed an increase in aggregate content of 1.5%. On-line UHP-SEC-µMALS data confirmed the HMW content to be dimeric (inset). The 1.5% dimeric content correlates to a Mw increase of mAb by ~ 2250 Da. The real time data showed an increase of ~ 2750 Da and is within 0.5% dimeric content of the on-line UHP-SEC-µMALS data.