
Figures & data
Figure 1. A.) Gradient from 0–100% buffer B in 10 minutes followed by 4 minutes of column flushing and 12 minutes of column equilibration. Twelve minutes of column equilibration are equalling ~28 column volumes at a flow rate of 0.4 mL min−Citation1. The buffer pH was monitored in real-time over the full duration of the run and is represented by the red profile. The pH trace indicates the chromatographic system to cover a pH-range of ~5.3 to ~10.2. B.) pH trace indicating full column equilibration exemplarily shown for gradient starting conditions of 50% buffer B. By the application of a 2-step equilibration procedure, full column equilibration was achieved in less than 10 minutes.
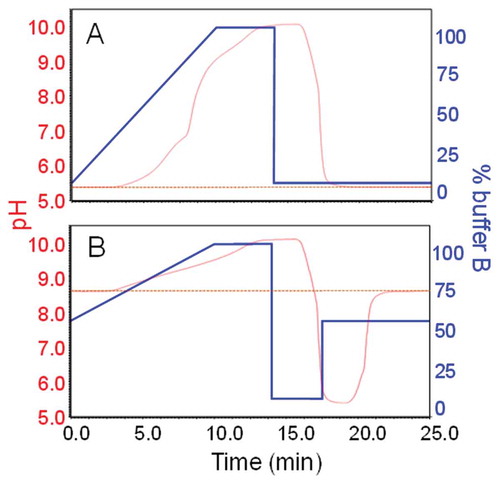
Figure 2. A.) Charge variant separation of seven monoclonal antibodies using a gradient from 0–100% buffer B in 10 min. B.) Charge variant separation after individual gradient optimisation. Instrument settings and gradients used for all mAbs are provided in the methods section.
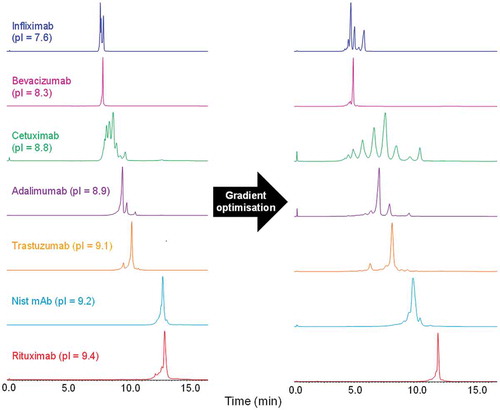
Figure 3. UV-chromatogram highlighting the charge variant separation of adalimumab. Sixteen different species were separated as detailed in the zoom window. The data were acquired using the optimised gradient for adalimumab ().
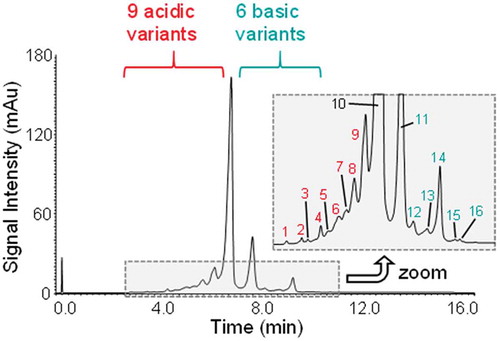
Figure 4. A.) BPCs of adalimumab at resolution settings 17,500, 35,000 and 70,000. B.) Mass spectra of the main variant peak. Different charge states are color coded and labelled. MS signal intensities reflected by the normalized level (NL) for the BPCs and the charge state envelopes are included in top right of images. C.) Magnification of charge state + 26 with labels of the three most abundant isoforms. Peaks are assigned by three symbols, a legend can be found on the bottom left.
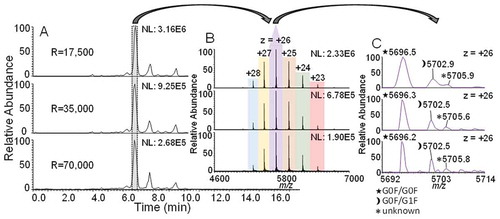
Figure 5. A.) BPC of adalimumab acquired at a resolution setting of 70,000. The main peak in blue corresponds to adalimumab without both C-terminal lysine residues, orange represents the variant containing one C-terminal lysine and green the variant carrying both C-terminal lysine residues. B.) BPC of CpB digested adalimumab. The arrows mark the species that have decreased or increased upon digestion. C.) Relative abundance of the 3 most intense glycoforms of all 3 lysine variants identified.
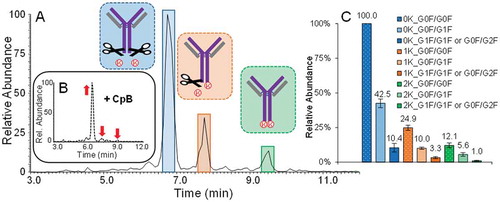
Figure 6. A.) Magnification of the BPC of an undigested and unstressed adalimumab sample, acquired at a resolution setting of 35,000. The peaks labelled from 1–3 are the main lysine variants as discussed above. Peaks labelled in blue from 4–6 are corresponding to the succinimide Asp containing versions. B.) BPC of a CpB digested sample. Former positions of peaks which have completely disappeared following CpB digestion are indicated by a red “X”. The co-eluting substance, suspected of being a basic variant derived by N-terminal Asp loss or proline amidation is indicated in yellow. The main species is increasing in abundance upon digestion as indicated by the arrow. C.) BPCs of samples incubated at elevated temperature for up to 11 days. D.) Increase of succinimide formation on Asp284 with ongoing incubation time at elevated temperature revealed by peptide mapping.
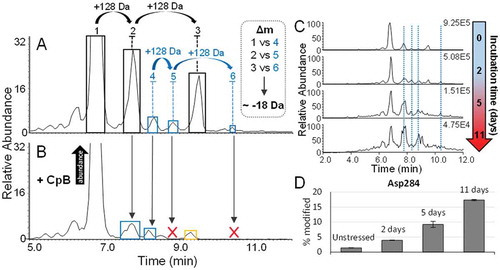
Figure 7. A.) BPC of adalimumab, acquired at a resolution setting of 35,000. The presence and retention times of glycated antibody forms is indicated by blue, orange and green labels in peak fronts of all three major lysine variants. Antibody variants that were found to carry deamidation are indicated in red. B.) Table showing the mass differences between the main glycoform of the three acidic species and the major lysine variant (no C-terminal lysine residues and G0F/G0F glycoform). The average masses are the masses that were experimentally observed. C.) Ratios of the three most abundant glycoforms of all three major lysine variants of the peak centres compared to peak fronts. D.) Asn329 deamidation of the main peak compared to the acidic peaks 1 and 2. This data is based on preparative peak collection followed by peptide mapping experiments.
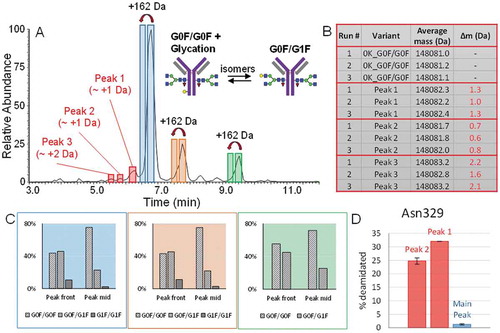
Figure 8. A.) Adalimumab BPC acquired at a resolution setting of 35,000 adjusted to a mass range of m/z 2,500 to 5,000. The spectra represent the charge state envelopes which were obtained when averaging each of the three peaks. The fragments corresponding to the same fragmentation events are illustrated in matching color (Peaks 1 and 3, blue and peak 2 purple). Their average masses after deconvolution are shown in the tables. The appearance of the charge envelope of the intact mAb in the averaged spectrum of peak 3 can be explained by the simultaneous elution of the fragment and acidic intact antibody variants which elute relatively early. B.) Fragmentation sites and resulting fragment species are shown on the intact mAb as well as by a magnification of the upper hinge region. The His-Thr site shown in purple is the one which has also been reported as a specific cleavage site of Cathepsin L1. C.) BPCs showing the mass range of m/z 2,500–5,000 of the unstressed drug product and the drug product after accelerated aging. Species which have disappeared during incubation are indicated by the red “X”. Newly generated variants and their mass shifts are indicated by red arrows and labels. As the peak labelled in grey contains more than one species in the unstressed drug product, the averaged spectra are shown in grey on the right hand side.
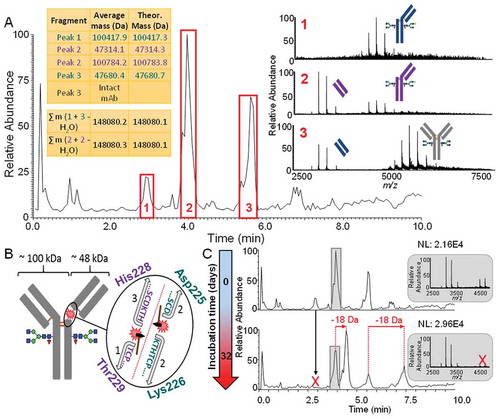
Table 1. Optimised gradients for all 7 mAbs. Corresponding separations can be obtained from .