Figures & data
Figure 1. Treatment of N87 xenograft mouse models with anti-HER2-ECD IgG1-vc-MMAEs. (A) Time course responses of the tumor size to the IgG1-vc-MMAE treatment for xenograft mouse models bearing N87 tumors were attained from the xenograft models randomly assigned into 8 groups and treated with 30 mg/kg of the respective IgG1-vc-MMAE at day 0, 7 and 14. Tumor size data for each of the mice of the treatment groups are shown in supplementary figure S1 (F). (B) endpoint tumor volume at day 21 for each of experimental subjects are plotted for each treatment group. (C) Kaplan-Meier survival curves depict the time courses of the fraction of the animal populations surviving the IgG1-vc-MMAE treatment (defined by tumor size below 400 mm3, see methods). (D)~(F) the description is the same as (A)~(C) for the 10 mg/kg IgG1-vc-MMAE treatments. Tumor size data for each of the mice of the treatment groups are shown in supplementary figure S1 (G).
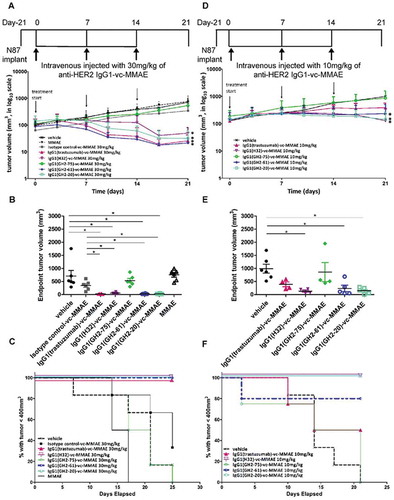
Figure 2. Treatment of N87 xenograft mouse models with anti-HER2-ECD scFv-PE38KDELs. (A) Data for the time course responses of the tumor size to the scFv-PE38KDEL treatment for xenograft mouse models bearing N87 tumors were attained from the xenograft models randomly assigned into 6 groups and treated with 0.166 mg/kg of the respective scFv-PE38KDEL at 0, 3 and 7 days as depicted in this panel. Note that the tumor size of the last one surviving mouse in the GH2-20 treatment group at day 7 and day 10 was not recorded and thus was not presented in the figure. Tumor size data for each of the mice of the treatment groups are shown in supplementary figure S3 (E). (B) Endpoint tumor volume at day 14 for each of experimental subjects are plotted for each treatment group. Data points for experimental subjects surviving the treatments are shown. (C) Kaplan-Meier survival curves depict the time courses of the fraction of the animal populations surviving (regardless of the tumor size) the scFv-PE38KDEL treatment.
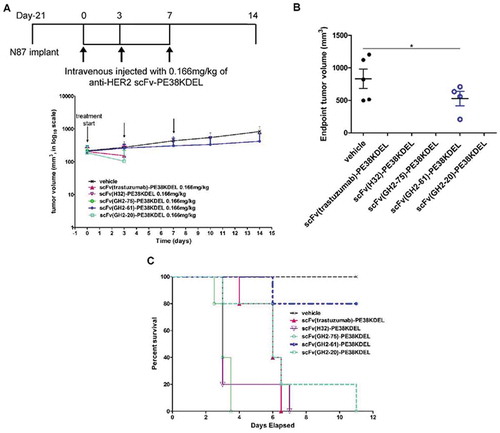
Figure 3. Treatment of N87 xenograft mouse models with anti-HER2-ECD IgG1-AL1-PE38KDELs. (A) Data for the time course responses of the tumor size to the IgG1-AL1-PE38KDEL treatment for xenograft mouse models bearing N87 tumors were attained from the xenograft models randomly assigned into 6 groups and treated (intraperitoneal injection) with 0.75 mg/kg of the respective IgG1-AL1-PE38KDEL at 0, 3 and 7 days as depicted in this panel. Tumor size data for each of the mice of the treatment groups are shown in supplementary figure S4 (B). (B) Endpoint tumor volume at day 10 for each of experimental subjects are plotted for each treatment group. Data points for experimental subjects surviving the treatments are shown. (C) Kaplan-Meier survival curves depict the time courses of the fraction of the xenograft mouse models bearing N87 tumors surviving (regardless of the tumor size) the IgG1-AL1-PE38KDEL treatment. (D) We repeated the same treatment protocol as shown in panel (C) on the mice without implanting xenograft tumors (n = 6 throughout). Kaplan-Meier survival curves depict the time courses of the fraction of the mice (n = 6 for each of the control/experimental groups) without implanting N87 tumors surviving the IgG1-AL1-PE38KDEL treatment.
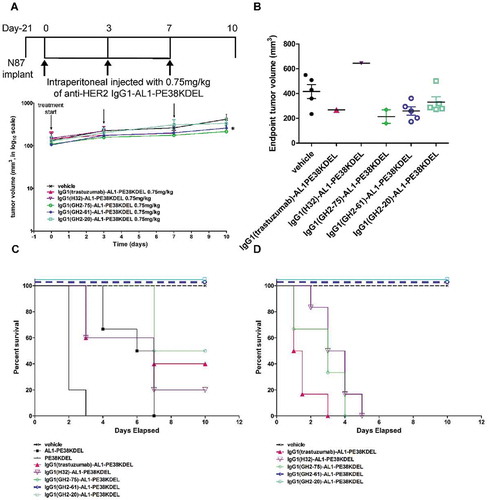
Figure 4. Internalization of anti-HER2 IgG1s in N87 cells. (A) Confocal microscopy images of N87 cells in the presence of anti-HER2-ECD IgG1s (5μg/mL concentration for each antibody) were taken 30 min after antibody addition at 4°C and 16 h at 37°C. HER2-antibody complexes were stained by Alexa Fluor 633-labeled anti-human antibody (red); lysosomes were stained by anti-human LAMP2 rabbit antibody followed by Alexa Fluor 488-labeled anti-rabbit antibody (green), and nuclei were stained by DAPI (blue). Scale bars: 10 μm. (B) Cellular uptake by N87 cells of the anti-HER2 DTPA-labeled IgG1 (Supplementary Figure S5 (B)) chelated with 111In are plotted versus incubation time with the 111In-labeled antibody; the mean values and standard deviations are calculated with three independent measurements. (C) Cell lysates from anti-HER2 IgG1-vc-MMAEs (10 μg/mL)-treated (18 h and 37°C) N87 cells were assessed by western blotting with β-tubulin as control. The details of the experimental procedures in this figure are described in Supplementary Methods.
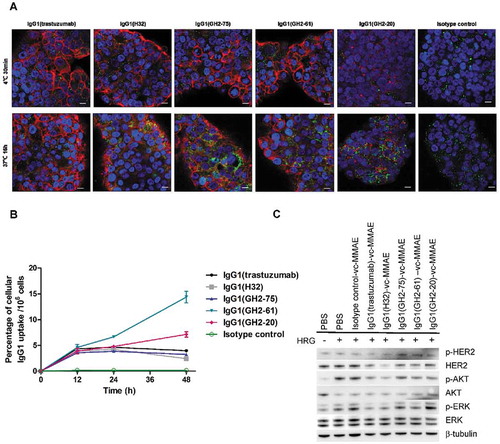
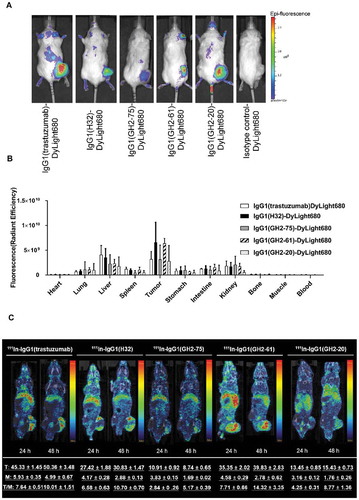
Figure 5. Bio-distributions of the anti-HER2 IgG1s in N87 xenograft models. (A) DyLight 680-labeled anti-HER2 IgG1s (3 mg/kg; Supplementary Figure S5 (A)) were injected into N87 tumor-bearing mice and imaged at 24 h post-injection. (B) Bio-distribution of DyLight 680-labeled anti-HER2 IgG1s in N87 tumor-bearing mice at 24 h post-injection (3 mg/kg) were determined ex vivo with IVIS (Supplementary Figure S6). The mean values and standard deviations are calculated with three independent measurements. (C) Anti-HER2 111In-labeled IgG1s were injected into N87 tumor-bearing mice and imaged at 24 h and 48 h after injection (4 mg/kg). The averaged values were calculated specifically for the images shown in the corresponding panels (n = 1). The details of the experimental procedures in this figure are described in supplementary methods.