Figures & data
Figure 1. The assay used to screen for monoclonal antibodies that block cell aggregation and aggregate coalescence in a 3D Matrigel environment.
(a) Diagram of procedure. (b) The absence of cell-cell aggregation and aggregate coalescence in a preparation containing non-tumorigenic MCF-10A cells derived from normal breast tissue. C, D, E. Cell-aggregation and aggregate coalescence in preparations of tumorigenic MB-231 cells (c) derived from a breast cancer, tumorigenic HTB-66 cells (d) derived from a melanoma, and tumorigenic U87 cells derived from a glioblastoma (e). D, day
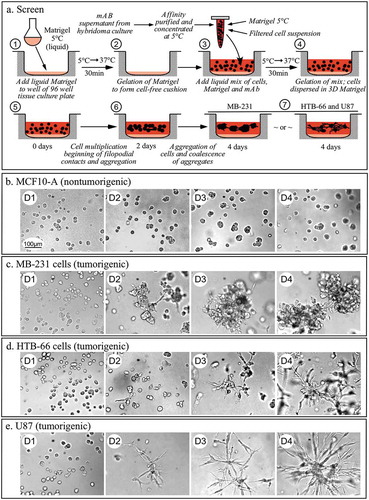
Table 1. Results of the first screen for mAbs that block cell aggregation and aggregate coalescence in a 3D Matrigel environment.
Table 2. Blocking activity of 27 anti-integrin mAbs.
Figure 2. Inhibition by anti-integrin ß-1 mAbs of cell aggregation and aggregate coalescence in a 3D Matrigel environment at 540, 0.6 and 0.3 µg per ml.
Control cultures were untreated. (a). P4C10. (b). AIIB2. (c). P5D2. (d). 7E2. The scale bar for all micrographs is provided in panel A.
Figure 3. Two-dimensional model of integrin α-3 ß-1, known mAb binding sites, and staining patterns of the 23 anti-integrin mAbs that exhibited cytostaining in the three tested cell lines.
(a) Models of integrin α-3 and integrin ß-1. (b) Binding sites of anti-integrin α-3 and anti-integrin ß-1 mAbs that exhibited blocking activity in one or more of the cell lines tested. (c) Binding sites and cell line staining patterns of anti-integrin mAbs that block. (d) Binding sites and cell line staining patterns of anti-integrin mAbs that do not block. mAb, monoclonal antibody; +++, intense staining; ++, moderate staining; +, low staining, -, no staining.
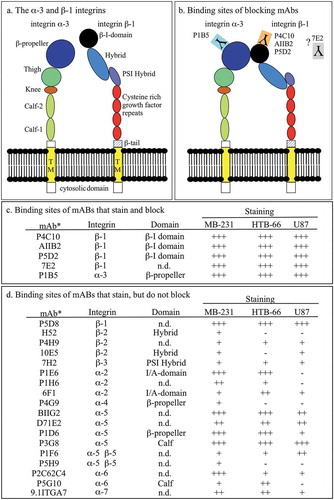
Figure 4. Indirect immunostaining with anti-integrin ß −1 and α −3 mAbs.
(a) Controls in which no mAb was added to cells of the three cell lines. (b) Staining by anti-integrin ß −1 mAbs P4C10, AIIB2, P5D2 and 7E2. (c) Staining by the anti-integrin α −3 mAb P1B5. Arrows indicate regions that are enlarged in the adjacent panel to the right. The scale bar for all images is presented in panel A, DIC image, MB-231.
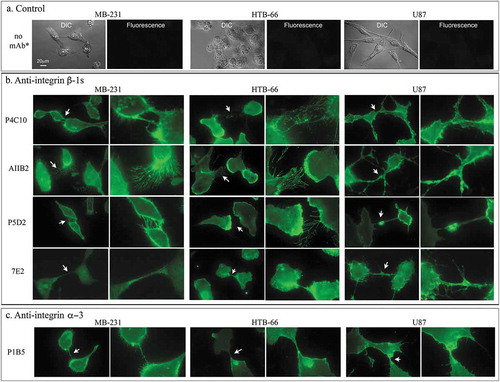
Figure 5. Colocalization of integrin ß-1 and integrin α-3 in both fixed and live cells.
(a) Indirect double staining of fixed MB-231, HTB-66 and U87 cells for integrin ß-1, using the rat-derived mAb AIIB2 and the fluor-tagged secondary antibody, anti-rat IgG Alexa Fluor 488 (green) and for integrin α-3, using the mouse-derived mAb P1B5 and the fluor-tagged secondary antibody, anti-mouse IgG Phycoerythrin (red). AIIB2, P1B5 and merged images are presented for each cell line. (b) Staining of live U87 clonal cell islands in a 3D Matrigel environment with fluor-tagged anti-integrin ß-1 mAb P4C10-HiLyte (750 nm) and fluor-tagged anti-integrin α-3 mAb P1B5-HiLyte (488 nm).
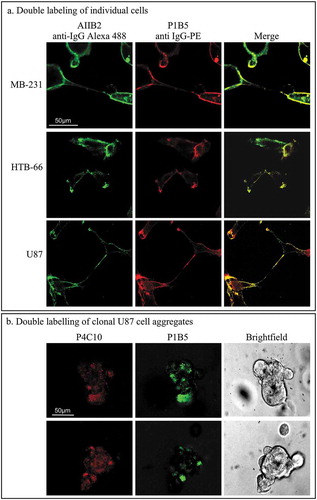
Figure 6. mAbs that block cell aggregation and aggregate coalescence do not inhibit cytokinesis or affect metabolic activity.
(a) Representative examples of U87 cells undergoing cytokinesis in the absence of mAbs and in 30 µg per ml of the blocking mAbs P4C10, P5D2 and 7E2. (b) Formation of small clonal islands occurs in P5D2 blocked U87 cells as demonstrated by the representative clonal aggregate formed. The time in hours after 3D Matrigel model set up is indicated. (c) MTT reduction in P4C10, AIIB2 and P5D2 blocked cultures occurs in the majority of cells and clonal aggregates
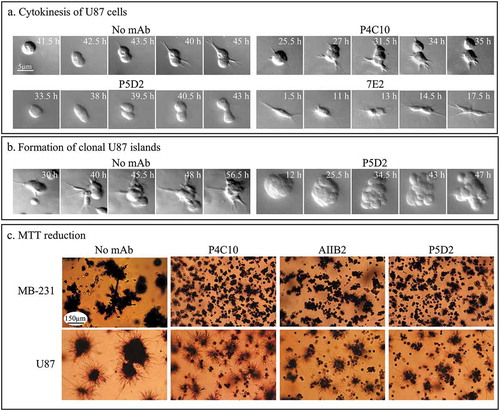
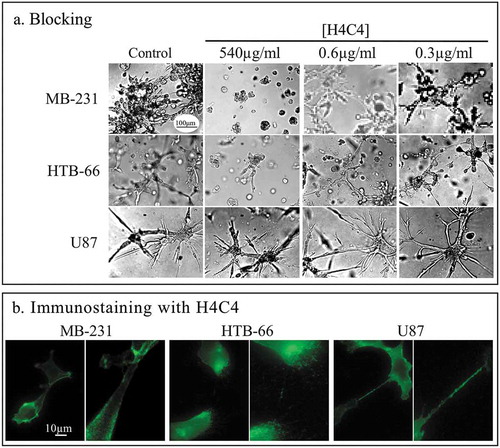
Figure 7. The anti-CD44 mAb H4C4 blocks aggregation and coalescence of only two of the three cell lines, but stains all three with equal intensity.
(a) Blocking of aggregation and coalescence by H4C4 at 540, 0.6 and 0.3 µg per ml. (b) Immunostaining of the three cell lines by H4C4.