Figures & data
Figure 1. Schematic representation of the structures of antibodies used in this study. Ab#1 is a bispecific antibody, Ab#2 is a monospecific bivalent antibody, and Ab#3 is a BiTE antibody that comprises two scFv fusion proteins. The target antigen of each paratope is described.
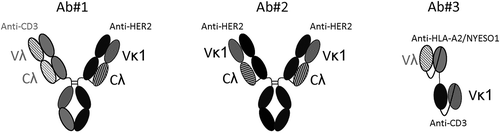
Figure 2. Separation of BsAbs by binding valency at various acidic pH while gradually decreasing the conductivity. Chromatograms show the separation of Ab#1 and Ab#2 at pH 2.4 (a), pH 2.7 (b), pH 3.0 (c), and pH 3.3 (d) while the NaCl concentration was gradually reduced from 100 mM to 0 mM. A wash of 1x PBS(−) was used before the elution step. A key in the figure gives the meaning of each line. The conductivity value at which peaks were seen at pH 2.7 and 3.0 are included in B and C.
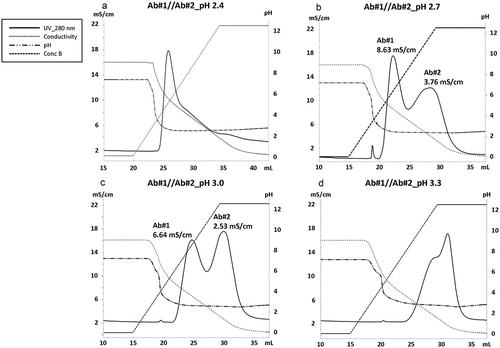
Figure 3. Separation of BsAb based on binding valency at various acidic pH while reducing the conductivity in a stepwise manner. (a) Chromatograms show the separation of Ab#1 and Ab#2 at pH 2.7 while the conductivity was reduced in a stepwise manner. A 1x PBS(−) wash was used before the elution step. A key in the figure gives the meaning of each line. (b) The CIEX chromatogram of the samples derived from peak 1 and peak 2 in (A) are shown in dotted and slide lines, respectively. Range of the peak assigned for Ab#1 and Ab#2 is specified by each arrow and the content of each peak area is calculated as shown in the bottom panel. (c and d) The same set of experiments done in (a) were conducted at pH 3.0 (c) and the CIEX results are shown in (d).
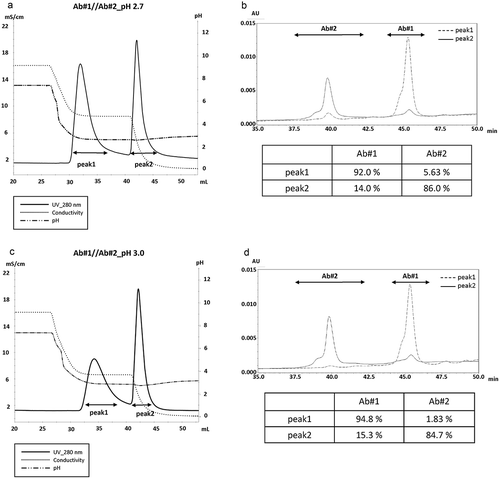
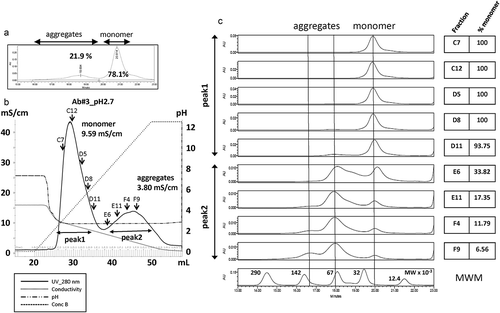
Figure 4. Separation by conductivity elution of monomer and oligomer/aggregates of an antibody fragment in BiTE format. (a) A chromatogram by SEC-HPLC shows the rate of aggregates and monomers of Ab#3 at pH 2.7. (b) A chromatogram shows the separation of aggregates and monomers of Ab#3 by conductivity gradient elution. A key in the figure gives the meaning of each line. The conductivity value of each peak is described. Arrows show fractions that were selected for further analysis. (c) SEC-HPLC chromatograms of Ab#3 in fractions from peak 1 and peak 2 selected in b and its monomer rate is shown. The results of an analysis of the molecular weight marker (MWM) is also shown at the bottom.