Figures & data
Table 1. Data collection and refinement statistics.
Figure 1. Crystal structures of the Rhesus macaque IgG1-4 Fc. (a) The overall structures are shown in a ribbon diagram with the two heavy chains (CH2-CH3 domains) in lighter and darker shades of green (MmIgG1), pink (MmIgG2), blue (MmIgG3) and yellow (MmIgG4). The sugars attached to N297 are shown as spheres colored by atom type (backbone color for carbon; red for oxygen and blue for nitrogen). The distances between Cα carbons of P238 are shown to indicate the differences in the distances between CH2 domains. (b) The structures of MmIgG1-4 Fcs were superimposed based on CH3-CH3 homodimer to show differences in the conformation and distances of CH2 domains in the Fc dimer. A 45° view shows the conformation of C’E, BC, and FG loops among CH2 domains of the Fcs. (c) Sequence alignment of the four subtypes of MmIgG Fc. The sequence identity among the four sequences is 86%. Residues of MmIgG2-4 different than MmIgG1 sequence are shaded in pink. The secondary elements as determined by the structures are shown above the sequence with arrows for β–strands, cylinders for α-helix and solid lines for random coil. Residue N297 is indicated with a red star and the C’E, BC, and FG loops are in boxes. (d) CH2−CH3 interface. Residues contributing to the interface through salt bridges/hydrogen bonds and residues of the hydrophobic “ball-in socket” joint are shown as sticks. Distances for hydrogen bonds/electrostatic interactions are as shown.
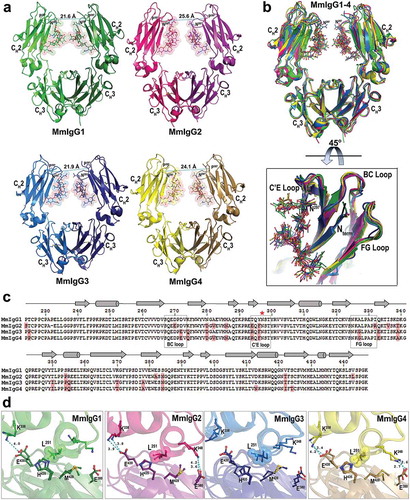
Table 2. Comparison of the conformational parameters of the Rhesus macaque and human IgG1-4 Fc. The parameters (distances and angles) describing properties of the dimeric assembly of Fcs were calculated from the structures of Fc of macaque and human IgG1 through 4. For human, only the fucosylated N297glycan core apo Fc structures of IgG1 and all apo Fc structures of IgG2-4 available in the Protein Data Bank (PDB, codes as shown) were selected. The top panel shows a graphic definition of each conformational parameter and include distances between selected residues for CH2 domain separation measurements; three-point angles to describe the relative orientations of the CH2 and CH3 domains in each monomer (CH2/CH3 angle) and each CH2 domain relative to the CH3-CH3 homodimer (CH2/CH3-CH3 angle), and the Cα atom angle bend (the angle between i-1, i, and i + 1 Cα atoms) of residues 339 to 343 of the heavy chain to describe the CH2-CH3 hinge.
Figure 2. Comparison of the overall structures of the Rhesus macaque and human IgG1-4 Fc. (a) Average RMSD values for main chain atoms for pairwise comparisons of CH2, CH3, CH2-CH3 monomers and CH2-CH3 dimers (Fc domain). The structures of the Fcs of human IgG1-4 used in the alignments include: IgG1, PDB codes: 3AVE, 4DZ8, 4W4N, 1H3Y and 1H3V; IgG2, PDB codes: 4HAF, 4HAG; IgG3, PDB code: 5W38 and IgG4, PDB codes: 4C54, 4C55, 5LG1. (b) Structural alignment of CH2, CH3, CH2-CH3 monomers, and CH2-CH3 dimers. MmFcs are colored in green for IgG1, pink for IgG2, blue for IgG3 and yellow for IgG4. Human Fcs are colored in grey. CH2-CH3 dimers are aligned by superimposing the CH3 domains.
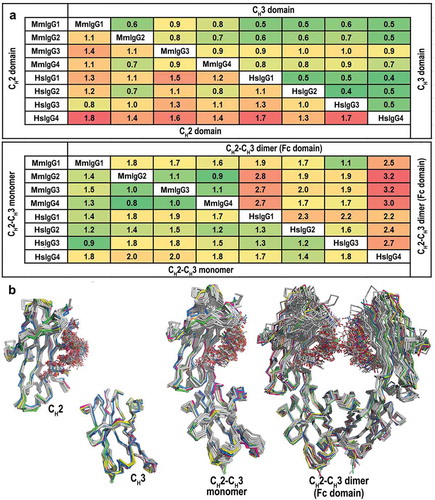
Figure 3. Structural comparisons of the Rhesus macaque and human Fcs. (a) Pairwise comparisons of the overall structures shown in a ribbon diagram with the two heavy chains (CH2-CH3 domains) in lighter and darker shades of green (MmIgG1), pink (MmIgG2), blue (MmIgG3) and yellow (MmIgG4) overlaid on their human counterpart in grey. The sugars attached to N297 are shown as sticks and side chains for residues that differ between macaque and human shown as balls and sticks colored by atom type (backbone color for carbon; red for oxygen and blue for nitrogen). Residues in the BC, C’E, and FG loops known in human to contribute to the Fcγ receptor binding are highlighted by color-matched circles. The same color scheme is used in remaining panels. (b) The conformation of C’E, BC, and FG loops among CH2 domains of the Fcs. (c) Pairwise sequence alignment of the four subtypes of macaque and human IgG Fc. Residues that are different between macaque and human are shaded in pink. The C’E, BC, and FG loops are in boxes. Residue N297 is indicated with a red star and residues at positions 405, 410 and 435 are indicated by a red arrow.
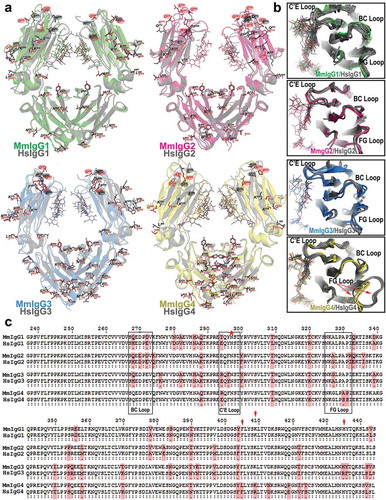
Figure 4. Differences in spectral quality in 1H-13C HSQC spectra of [13CU-glycan]-Fcs collected at 18.8 T and 50ºC. These spectra were processed with only a sine-squared line-broadening function in the direct dimension. The vertical arrow highlights the peak which corresponds to the GlcNAc1 H6-C1 correlation. Peaks within the dashed boxes are used for comparisons of spectra in the main text.
![Figure 4. Differences in spectral quality in 1H-13C HSQC spectra of [13CU-glycan]-Fcs collected at 18.8 T and 50ºC. These spectra were processed with only a sine-squared line-broadening function in the direct dimension. The vertical arrow highlights the peak which corresponds to the GlcNAc1 H6-C1 correlation. Peaks within the dashed boxes are used for comparisons of spectra in the main text.](/cms/asset/8dd8ed71-2499-41bc-b5d1-0821c48290ba/kmab_a_1589852_f0004_c.jpg)
Figure 5. Differences in the anomeric 1H1-13C1 correlation in the N297-linked GlcNAc1 residue (a) at 18.8 T and 50ºC and (b) at 14.1 T and 50ºC. These spectra were processed with a combination of sine-squared and 20 Hz exponential multiplier line-broadening functions in the direct dimension.
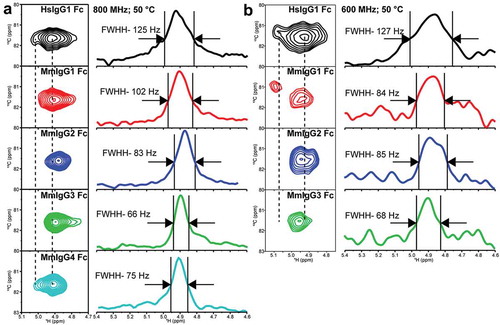
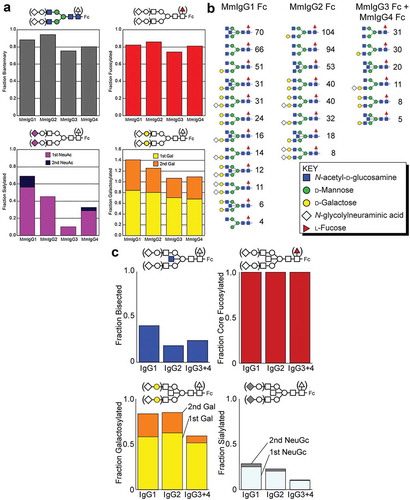
Figure 6. Analysis of the N-glycan composition of the Fcs of MmIgG1-4 expressed in HEK293F cells and present in RM sera. (a) N-glycan composition of the Fcs of MmIgG1-4 expressed in HEK293F is shown with NeuAc = N-acetylneuraminic acid; Gal = galactose. (a) left panel shows the percentage of complex-type N-glycans. The upper right panel shows the percent fucosylated, the lower left shows the percentage with one or two sialic acid residues and the lower right indicates galactosylation. (b) and (c) Composition and configuration of the Fc N-glycan of MmIgG1-4 present in RM sera. Comparable results from a different animal are shown in Figure S3. Fc N-glycans identified by LC-ESI-MS/MS are ranked according to spectral counts (panel B). Incidence of each N-glycan modification observed. NeuGc = N-glycolylneuraminic acid; Gal = galactose (panel C).