Figures & data
Figure 1. LLPS observed with mAb-X and interfered with the downstream manufacturing process. (a) Downstream process flow for mAb-X, purification intermediate solution (at 4oC), and the corresponding solution composition. mg/mL concentration is for mAb-X. The purification intermediates from the grey-shaded steps showed LLPS under the refrigerated conditions. (b) Aggregation rate for mAb-X purification intermediates at different temperatures. (c) Liquid-liquid coexistence curves for mAb-X under the two indicated conditions.
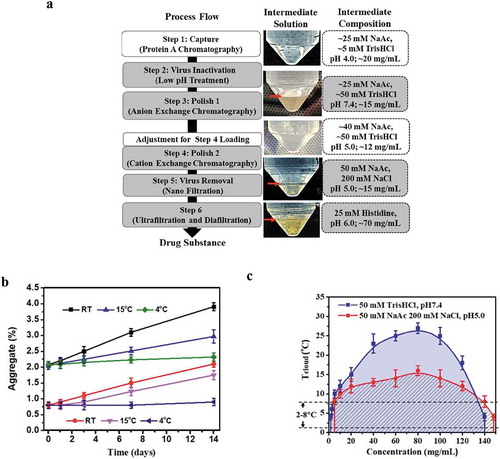
Figure 2. The effects of pH and sodium chloride concentration on the LLPS seen with mAb-X purification intermediates (a) Solution behaviors at pH 7.4 with varying sodium chloride concentrations. (b) Solution behaviors at pH 5.0 with varying sodium chloride concentrations. (c) Solution behavior of mAb-X at different pH values without sodium chloride.
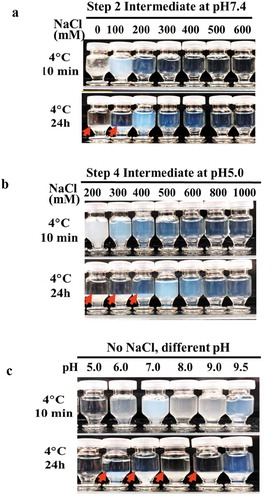
Figure 3. Mapping the domain of mAb-X associated with LLPS. (a) Solution behavior of full-length mAb-X IgG, F(ab′)2, and Fab. (b) Solutions for mAb-X formatted with different IgG subclasses or light-chain isotypes. (c) Solutions for mAb-X, mAb-Y, and chimeric mAbs. Samples were prepared in 50 mM Tris-HCl, pH 7.4, at approximately 12 mg/mL, and stored at 4ºC for 24 hours.
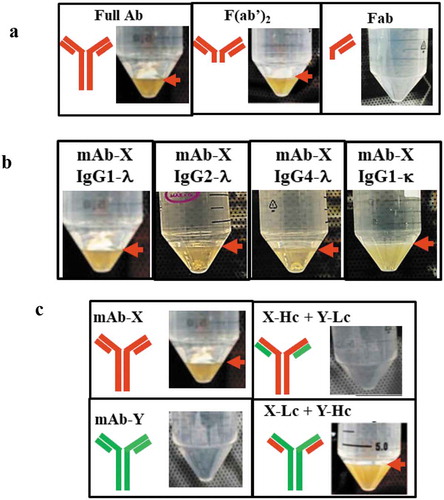
Figure 4. Correlation of LLPS with mAb-X self-association. (a) Plot of self-diffusion coefficients against protein concentration to obtain the kD for full mAb-X IgG, F(ab′)2, and Fab. The samples were prepared in 50 mM Tris-HCl, pH 7.4. (b) The effects of sodium chloride on the kD of mAb-X in 50 mM Tris-HCl, pH 7.4. (c) Correlation of kD (obtained by DLS) and plasma shift (obtained by AC-SINS) for seven mAbs.
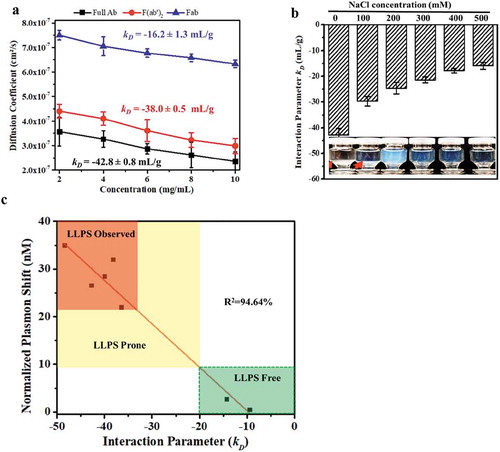
Table 1. Mutation design for the selected charged CDR residues.
Figure 5. Identification of surface-exposed charged amino acids in the CDRs, based on the homology model. (a) Protein sequences of light chain CDRs for mAb-X and mAb-Y, showing positively (blue) and negatively (red) charged amino acids. (b-c) Molecular surface of mAb-X (b) and mAb-Y (c) Variable fragment homology models generated using the MOE.2016 software package. VL CDR charge amino acids are illustrated on the surface. VH CDR loops are also illustrated.
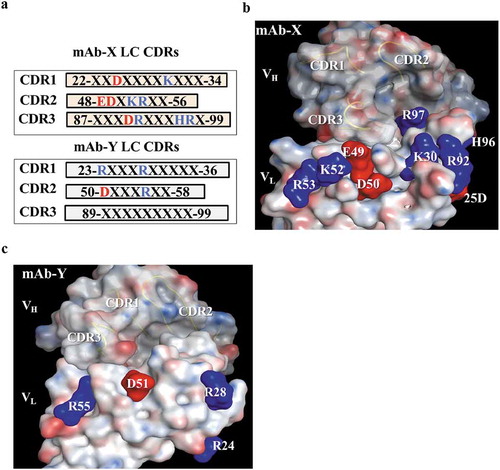
Table 2. Molecular properties and self-association behaviors of mAb-X mutants.
Figure 6. Proposed model of mAb-X self-interaction. (a) Hydrodynamic size as a function of concentration for full mAb-X, F(ab′)2 and Fab. Size (as a dimer, trimer, or tetramer) of the self-associated complexes was estimated by DLS data. (b) Proposed model for self-interactions.
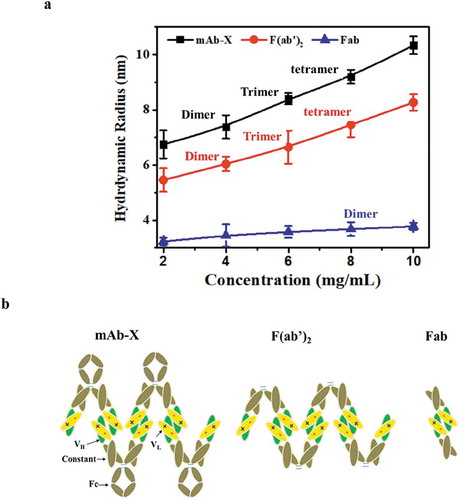
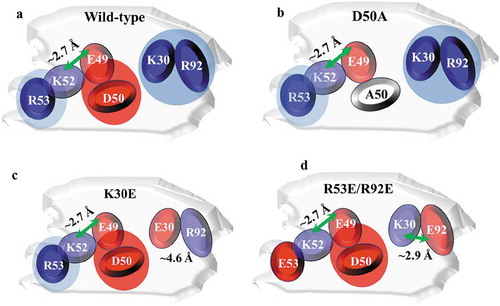
Figure 7. Illustration of proposed CDR charge distributions of the mAb-X wild-type (a) and LLPS-free mutants (b-d). Blue and red shades represent positively and negatively charged patches, respectively. Green arrows represent potential salt bridges.