
Figures & data
Figure 1. Depletion of splenic and liver macrophages in wild type mice does not affect the half-life of IgG. (a) C57BL/6J mice (2–3 mice/group) were intravenously treated with clodronate (1.5 mg/dose) or PBS (control) liposomes at 0 h and 48 h, and single cell suspensions from spleens and livers were isolated at 120 h. Macrophage populations were analyzed using flow cytometry and data for one representative mouse from each group is shown. The gating strategies used for the identification of macrophage (MØ) populations are shown in Supplementary Figure 9C and D. (b) C57BL/6J mice (5–6 mice/group) were intravenously treated with clodronate (1.5 mg/dose) or PBS (control) liposomes at 0 h and 48 h. 125I-labeled mIgG1 was injected (i.v.) at 18 h following the first injection of clodronate liposomes, and whole body radioactivity levels were determined at the indicated times. (c) β-phase half-lives of mIgG1 in different mice obtained by fitting the pharmacokinetic data to a decaying bi-exponential model. Error bars indicate SEM. N.S., no significant difference (p > .05; two-tailed Student‘s t-test). Data shown in panels b and c is representative of two independent experiments.
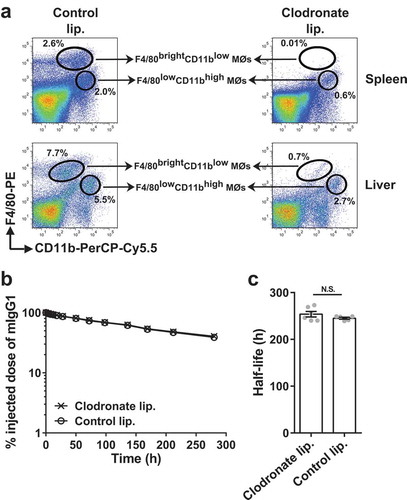
Figure 2. Depletion of splenic and liver macrophages in G-KO mice results in an increase in half-life and serum levels of IgG. G-KO mice were treated with clodronate (1.5 mg/dose) or PBS (control) liposomes at 0 h and 48 h. (a, b) 125I-labeled mIgG1 was injected (i.v.) at 18 h, and whole body radioactivity levels determined at the indicated times (a; 3–4 mice/group) post-antibody injection. Data shown is representative of two independent experiments. (b) β-phase half-lives of mIgG1 were obtained by fitting the pharmacokinetic data to a decaying mono-exponential model. (c) Normalized IgG levels in serum samples collected 0 h prior to and 201 h post-first injection of clodronate liposomes. Error bars indicate SEM. Significant differences (**, p < .01; ***, p < .001; two-tailed Student‘s t-test) between the groups are indicated. N.S., no significant difference (p > .05; two-tailed Student‘s t-test). Data shown for panels b and c is combined from two independent experiments (5–9 mice/group).
Table 1. Summary of FcRn expression, half-lives of mouse IgG1 and serum IgG levels in mice expressing FcRn in different cell types.
Figure 3. Specificity of loss of FcRn function in FcRnflox/flox mice with site-specific Cre expression. (a) Splenocytes were isolated, pooled (from 2 to 3 mice/genotype) and incubated with anti-FcγRIIB/III (2.4G2) antibody at 4°C followed by Alexa 647-labeled MST-HN or H435A mutant at 37°C to assess FcRn-mediated uptake. Fluorescence levels associated with each of the indicated cell types were determined using flow cytometry. Cell populations were identified as follows: macrophages, F4/80brightCD11blow; monocytes, Ly6ChighCD11bint; DCs, CD11c+CD11b+; B cells, CD23highCD21low and neutrophils, Ly6CintCD11bhigh. The gating strategies used for the identification of these cell types are shown in Supplementary Figure 8A-C. Data shown is representative of at least two independent experiments. (b) Mice were perfused and kidneys, lungs and livers were harvested. Single-cell suspensions from these organs were isolated, pooled (from 2 mice/genotype) and treated as in panel A except that CD45+F4/80brightCD11blow and CD45+F4/80lowCD11bhigh macrophages were analyzed. These macrophage populations were identified using the gating strategy shown in Supplementary Figure 8D. M-KO, LysM-Cre-FcRnflox/flox (macrophage-specific FcRn KO); M-Het, LysM-Cre-FcRnflox/+ (control); B-DC-KO, CD19-Cre-FcRnflox/flox (B cell- and DC-specific FcRn KO); B-DC-Het, CD19-Cre-FcRnflox/+ (control); Tie2e-KO, Tie2e-Cre-FcRnflox/flox (multiple cell type-specific FcRn KO); Tie2e-Het, Tie2e-Cre-FcRnflox/+ (control); G-KO, FcRn-/- (global FcRn KO); MST-HN, mutated human IgG1 with increased affinity for FcRn;Citation35 H435A, mutated (control) human IgG1 with negligible binding for FcRn.Citation36 Data shown is representative of at least two independent experiments.
Figure 4. The levels of functional FcRn are reduced in endothelial cells in Tie2e-KO mice but not in M-KO mice. Single cell suspensions from heart and lung were isolated, pooled (from 3–5 mice/genotype) and incubated with anti-FcγRIIB/III (2.4G2) antibody at 4°C followed by Alexa 647-labeled MST-HN or H435A mutant at 37°C to assess FcRn-mediated uptake. Fluorescence levels associated with heart- or lung-derived CD31+CD105+isolectin B4+ endothelial cells (ECs) were determined using flow cytometry. ECs were identified according to the gating strategies shown in Supplementary Figure 9A and B. M-KO, LysM-Cre-FcRnflox/flox (macrophage-specific FcRn KO); M-Het, LysM-Cre-FcRnflox/+ (control); Tie2e-KO, Tie2e-Cre-FcRnflox/flox (FcRn KO in multiple different cell types); Tie2e-Het, Tie2e-Cre-FcRnflox/+ (control); G-KO, FcRn-/- (global FcRn KO); MST-HN, mutated human IgG1 with increased affinity towards FcRn;Citation35 H435A, mutated (control) human IgG1 with negligible binding towards FcRn.Citation36 Data shown are representative of at least two independent experiments.
Figure 5. Loss of FcRn function in macrophages results in substantial reductions in the half-life of IgG. (a) Different FcRn KO and control mice (3–6 mice/genotype) were injected (i.v.) with 125I-labeled mIgG1 and whole body radioactivity levels determined at the indicated times. Data shown are representative of at least two independent experiments. (b) β-phase half-lives of mIgG1 in different FcRn KO and control mice were determined by fitting the pharmacokinetic data to a mono-exponential (M-KO, Tie2e-KO, and G-KO) or bi-exponential model (M-Het, Tie2e-Het, B-DC-Het, B-DC-KO and C57BL/6J). Error bars indicate SEM. Significant differences (*, p < .05; **, p < .01; ***, p < .001; one-way ANOVA followed by Tukey‘s multiple comparisons test) between the groups are indicated. M-KO, LysM-Cre-FcRnflox/flox (macrophage-specific FcRn KO); M-Het, LysM-Cre-FcRnflox/+ (control); B-DC-KO, CD19-Cre-FcRnflox/flox (B cell- and DC-specific FcRn KO); B-DC-Het, CD19-Cre-FcRnflox/+ (control); Tie2e-KO, Tie2e-Cre-FcRnflox/flox (FcRn KO in multiple different cell types); Tie2e-Het, Tie2e-Cre-FcRnflox/+ (control); G-KO, FcRn-/- (global FcRn KO). Data shown in panel b is combined from at least two independent experiments (n = 6–14 mice/group).
Figure 6. Loss of FcRn function in macrophages results in ~2–3 fold reductions in steady state levels of serum IgG and albumin and reduces the effects of FcRn inhibition. Serum IgG (a) and albumin (b) levels in the different mouse strains. Data shown are derived from 5 to 13 mice/genotype. (c) M-KO, M-Het, and G-KO mice were treated (i.v.) with 1 mg MST-HN mutant and serum IgG levels determined at the indicated times post-injection. Error bars indicate SEM. Significant differences [*, p < .05; **, p < .01; ***, p < .001; one-way ANOVA followed by Tukey‘s (a, b) or Dunnett‘s (c) multiple comparisons test] between the groups are indicated. M-KO, LysM-Cre-FcRnflox/flox (macrophage-specific FcRn KO); M-Het, LysM-Cre-FcRnflox/+ (control); Tie2e-KO, Tie2e-Cre-FcRnflox/flox (multiple cell type-specific FcRn KO); Tie2e-Het, Tie2e-Cre-FcRnflox/+ (control); G-KO, FcRn-/- (global FcRn KO); MST-HN, FcRn inhibitor. Data shown in panel c is combined from two independent experiments (n = 8–9 mice/group).
![Figure 6. Loss of FcRn function in macrophages results in ~2–3 fold reductions in steady state levels of serum IgG and albumin and reduces the effects of FcRn inhibition. Serum IgG (a) and albumin (b) levels in the different mouse strains. Data shown are derived from 5 to 13 mice/genotype. (c) M-KO, M-Het, and G-KO mice were treated (i.v.) with 1 mg MST-HN mutant and serum IgG levels determined at the indicated times post-injection. Error bars indicate SEM. Significant differences [*, p < .05; **, p < .01; ***, p < .001; one-way ANOVA followed by Tukey‘s (a, b) or Dunnett‘s (c) multiple comparisons test] between the groups are indicated. M-KO, LysM-Cre-FcRnflox/flox (macrophage-specific FcRn KO); M-Het, LysM-Cre-FcRnflox/+ (control); Tie2e-KO, Tie2e-Cre-FcRnflox/flox (multiple cell type-specific FcRn KO); Tie2e-Het, Tie2e-Cre-FcRnflox/+ (control); G-KO, FcRn-/- (global FcRn KO); MST-HN, FcRn inhibitor. Data shown in panel c is combined from two independent experiments (n = 8–9 mice/group).](/cms/asset/d06bd5cb-28c6-4c54-b3c6-5be86a249505/kmab_a_1602459_f0006_b.gif)