Figures & data
Figure 1. Structure and characterizations of anti-CD30-MCC-DM1. a, Structure of anti-CD30-MCC-DM1. b, Deconvoluted intact mass spectra of anti-CD30 mAb and anti-CD30-MCC-DM1 acquired by LC-MS; all samples were treated with PNGase F. c, Electrophoretogram of anti-CD30 mAb and anti-CD30-MCC-DM1 acquired by imaged capillary isoelectric focusing. d, In vitro sensitivity of Karpas 299 cells to anti-CD30 mAb and ADCs. Karpas 299 cells were plated at 5000 cells/well and were exposed to a gradient titration of anti-CD30 (the parental mAb cAC10); anti-CD30-MCC-DM1; DM1 (the free drug); ADCETRIS (anti-CD30-vc-MMAE); or T-DM1 (a control ADC (anti-HER2-MCC-DM1)). Cells were assessed for cytotoxicity by the Alamar Blue assay after 96 h of continuous exposure, as described in the “Materials and methods.” The percentage cell viability was relative to untreated control wells. Results for each study are plotted as the mean (± SEM).
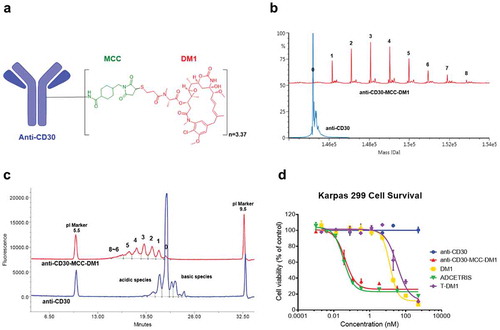
Table 1. Cytotoxicity of anti-CD30-MCC-DM1 and free DM1 on lymphoma lines.
Figure 2. Binding and internalization of anti-CD30-MCC-DM1. a, Competition binding of anti-CD30-MCC-DM1 to CD30-positive cells. Karpas 299, HH and L428 cells were combined with biotinylated anti-CD30 mAb and serial dilutions of either anti-CD30 mAb or anti-CD30-MCC-DM1. The normalized fluorescence intensities were plotted versus mAb concentration as described in the “Materials and methods.” b, internalization of anti-CD30-MCC-DM1 into CD30-positive cells. pHAb dye-conjugated anti-CD30 mAb and anti-CD30-MCC-DM1 were added to the Karpas 299, HH, and L428 cells and incubated for various time durations. Mean and standard deviations from triplicate readings are plotted.
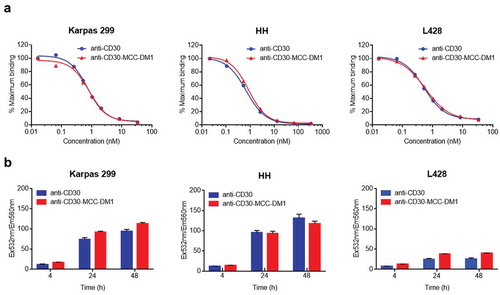
Figure 3. Generation of free drug in cells treated with anti-CD30-MCC-DM1. Intracellular (a) and extracellular (b) concentrations of Lys-MCC-DM1 from 0 to 72 h of exposure with anti-CD30-MCC-DM1 small molecule were determined with an LC-MS/MS method in CD30-positive (Karpas 299, HH, and L428) and CD30-negative (Ramos) cell cultures. Results for each test are plotted as the mean (± SEM).
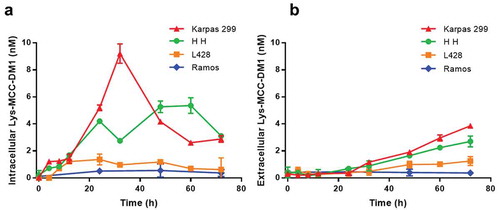
Figure 4. Effects of mAb, ADC and DM1 on the cell cycle. CD30-positive Karpas 299, HH, and L428 and CD30-negative Ramos cells were untreated or treated with anti-CD30 mAb, anti-CD30-MCC-DM1, control ADC T-DM1, or DM1 (an equimolar amount to anti-CD30-MCC-DM1) and incubated for 0, 16, 24, or 48 h. At each time point, the cells were labeled with propidium iodide, and the cell cycle position was measured by flow cytometry.
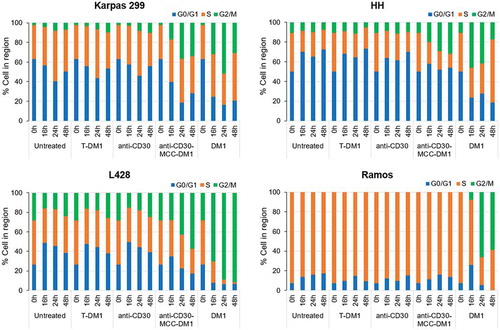
Figure 5. Bystander activities of ADCs. CD30-positive and CD30-negative cells were co-cultured in dual chamber Transwell dishes. The CD30-positive cells (Karpas 299 cells, HH cells and L428 cells) were plated into the upper Transwell chamber, and CD30-negative Ramos cells were plated into the lower Transwell chamber. Cocultures were either untreated or treated with anti-CD30-MCC-DM1 or ADCETRIS. Counting represents the number of surviving CD30-positive and CD30-negative cells following 72, 96, and 120 h treatment. Results for each test are plotted as the mean (± SEM).
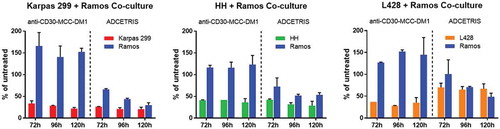
Figure 6. Efficacy of anti-CD30-MCC-DM1 in subcutaneous inoculation tumor xenograft models. Tumor growth is plotted as the mean (± SEM) tumor volume of each group receiving intravenous dose of vehicle, anti-CD30-MCC-DM1, anti-CD30, or ADCETRIS over the duration of the study. a, HH xenograft CB-17/SCID mice (n = 8 mice/group) with an average starting tumor volume of 98 mm3 were treated with a single dose as indicated. b, Karpas 299 xenograft CB-17/SCID mice (n = 8 mice/group) with an average starting tumor volume of 99 mm3 were treated with a single dose as indicated. c, L428 xenograft NPG mice (n = 8 mice/group) with an average starting tumor volume of 106 mm3 were treated with multiple doses as indicated.
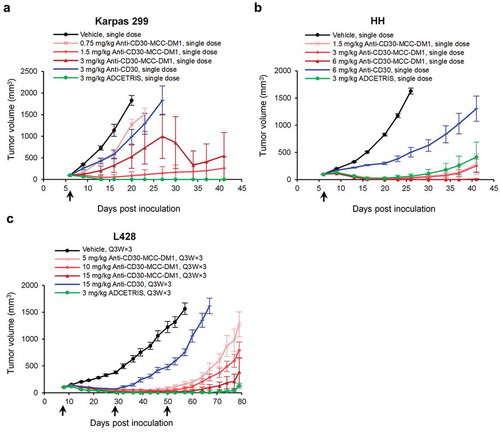
Figure 7. Pharmacokinetics of anti-CD30-MCC-DM1 in cynomolgus monkeys. Groups of cynomolgus monkeys (n = 8) were treated with a single dose of 1, 4, or 12 mg/kg anti-CD30-MCC-DM1 or 4 mg/kg anti-CD30 mAb mixed with 0.07 mg/kg DM1. Concentrations of total and conjugated antibody (a) as well as of DM1 (b) in plasma were analyzed by ELISA or LC-MS/MS and plotted as the mean (± SD).
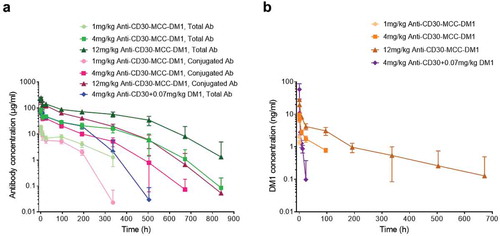
Table 2. Pharmacokinetics of anti-CD30-MCC-DM1 in monkeys.
Table 3. Toxicity study of anti-CD30-MCC-DM1 and ADCETRIS in monkeys.
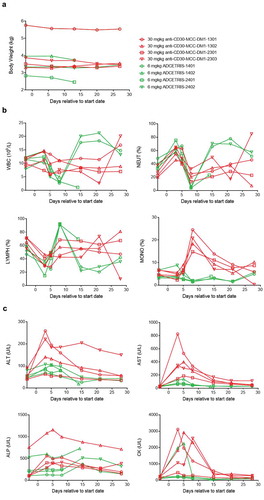
Figure 8. Effect of anti-CD30-MCC-DM1 and ADCETRIS on cynomolgus monkeys. Groups of cynomolgus monkeys (n = 4) were treated with a single dose of 30 mg/kg anti-CD30-MCC-DM1 or 6 mg/kg ADCETRIS. The effects of these drugs on body weight (a), selected hematology (b), and selected serum biochemistry (c) are presented with individual data. ALT: alanine aminotransferase, AST: aspartate aminotransferase, ALP: alkaline phosphatase, CK: creatine kinase, WBC: white blood cell count, NEUT: neutrophils, LYMPH: lymphocytes, MONO: monocytes.