Figures & data
Figure 1. The process for creating asymmetrically oxidized bispecific molecules (BsAb) is presented. (a) Peracetic acid treatment of mAb1 (blue) or mAb2 (peach) resulted in methionine oxidation (illustrated as red lines) throughout the molecule. (b) Combinations of non-oxidized (A) and/or oxidized (B) mAb1 and mAb2 were pooled prior to Fab arm exchange to generate control BsAb1 (AA), asymmetrically oxidized BsAb2 (AB) and BsAb3 (BA), and symmetrically oxidized BsAbs (BB). All BsAbs were purified to the final product prior to analytical characterization.
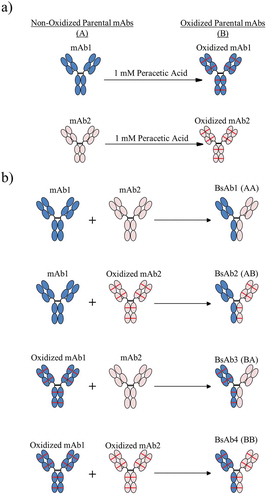
Table 1. Purity and free thiol levels for the BsAb intermediates and purified final products.
Figure 2. HIC chromatograms of BsAb products. Chromatograms for post-FAE reaction intermediates and final-purified products are shown in the top and bottom panels, respectively.
Figure 3. Subunit MS analysis of mAb and BsAb. (a) The deconvoluted spectra for control and oxidized mAb1 and mAb2 are shown in the left and right panels, respectively. (b) The deconvoluted spectra for BsAb1, BsAb2, BsAb3, and BsAb4 are shown in order from top to bottom. mAb1, mAb2, and methionine oxidation are shown with blue fill, peach fill, and red lines, respectively.
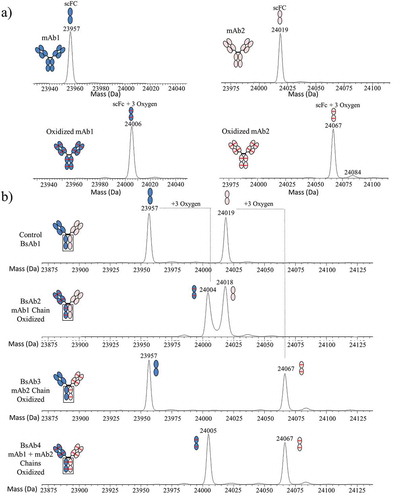
Table 2. Methionine 254 oxidation levels and Fc binding results for BsAb final products.
Figure 4. Protein A affinity chromatography chromatograms for BsAb1, BsAb2, BsAb3, and BsAb4 intact IgG. Protein absorbance was monitored at 280 nm.
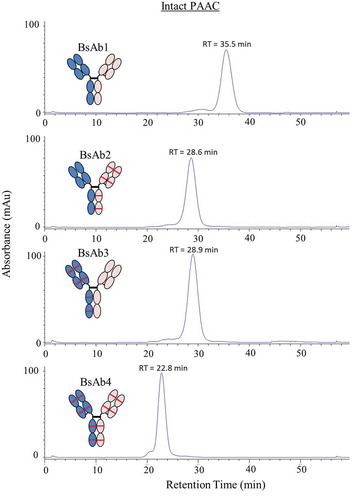
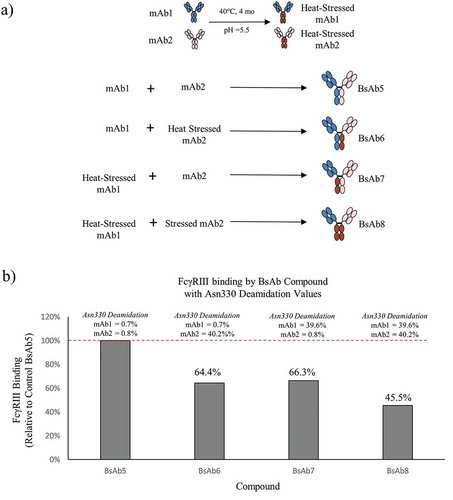
Figure 5. The process for creating bispecific antibodies with asymmetric deamidation at Asn330 is presented. (a) mAb1 (blue) and mAb2 (peach) were stressed at 40°C at pH 5.5 to induce selective deamidation at the Asn330 residue in the Fc Region (brown with red lines). Combinations of native or stressed mAb1 and mAb2 were pooled prior to Fab-arm exchange to generate control BsAb5, asymmetrically deamidated BsAb6 and BsAb7, and symmetrically deamidated BsAb8. (b) The bar plot illustrates the levels of FcγRIIIa binding of BsAb6, BsAb7, and BsAb8 relative to the control BsAb5 sample. The HC Asn330 deamidation values for the mAb1 and mAb2 arms of each BsAb are shown above the corresponding bar.