Figures & data
Table 1. Number of water molecules and the initial simulation box sizes in Å3 of all considered antibodies.
Figure 1. Hierarchical clustering analysis of 31 µs of trajectories (3130 frames) of the CDR-L3 loop and CDR-H3 loop gained by aligning to the whole Fv and using a distance criterion of 2.8 Å and 4.5 Å respectively. Vertical tics in the dendrogram show which cluster the crystal structures belong to (3V6F AGless, 3V6Z AGed). The dendrograms for the CDR-L3 and CDR-H3 loop are illustrated with the corresponding plot on the right showing the cluster populations and the number of transitions observed in the simulations.
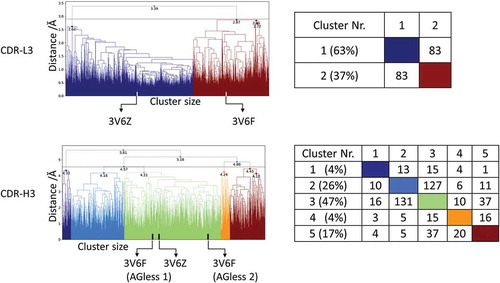
Figure 2. Structural ensemble of the CDR-H3 loop and CDR-L3 loop color coded according to the dendrogram in .
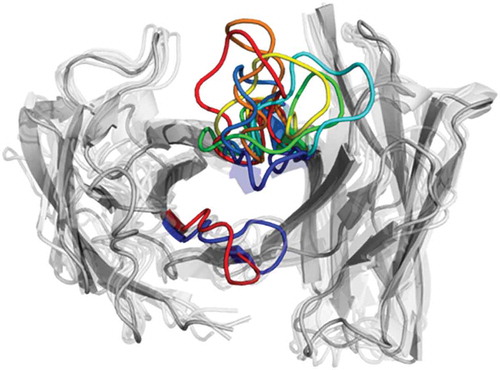
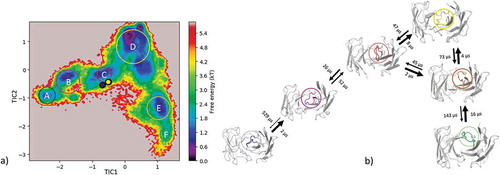
Figure 3. Estimated free energy surface of the CDR-L3 loop (top left) and the CDR-H3 loop (bottom left) based on tICA including the projected crystal structures. The AGed X-ray structure is colored yellow, while the AGless antibody X-ray structure, which shows crystal contacts () in the unit cell, are colored in blue and cyan. The macrostates are illustrated as circles and were identified with PCCA+ clustering. Below, the first mean passage times combined with the representative macrostate structures based on a tICA of the CDR-L3 (right) and the CDR-H3 (right) loop are shown. The thickness of the circles represents state probabilities, while the width of the arrows relates to the transition timescales.
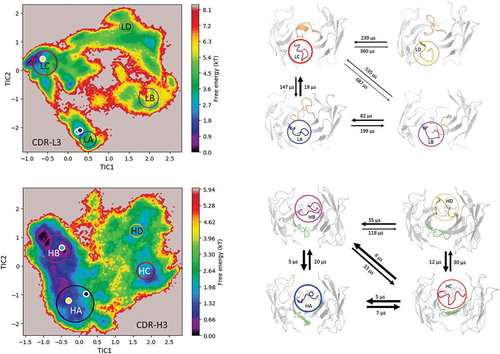
Figure 12. Crystal contacts of the 3V6F antibody Fab with the tail of a symmetry mate, which causes a rearrangement of the CDR-H3 loop. The AGed X-ray structure (3V6Z) is shown in yellow. The residues showing interactions with the CDR-H3 loop are colored red.
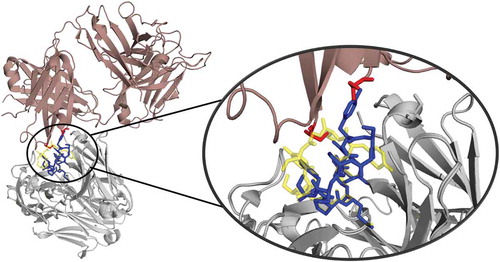
Figure 4. Hierarchical clustering analysis of 9.3 µs of trajectories (930 frames) of the Efalizumab Fv CDR-H3 loop obtained by aligning on the whole Fv and using a distance criterion of 3.1 Å. Two black vertical lines in the dendrogram show which cluster the crystal structures belong to (3EO9 AGless, 3EOA AGed). The dendrogram for the CDR-H3 loop is illustrated with the corresponding plot on the right showing the cluster populations and the number of transitions observed in the simulations. Below the structural ensemble of the CDR-H3 loop is displayed color coded according to the dendrogram.
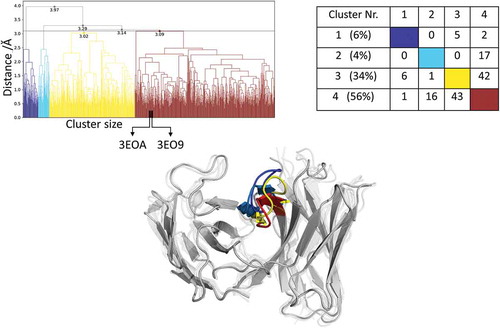
Figure 5. (a) Estimated free energy surface of the CDR-H3 loop based on tICA including the projected crystal structures. The AGed X-ray structure is colored yellow, while the AGless X-ray structure is colored in blue. The macrostates are illustrated as circles and were identified with PCCA+ clustering. (b) First mean passage times combined with the representative macrostate structures are based on tICA of the CDR-H3 loop. The thickness of the circles represents state probabilities, while the width of the arrows relates to the strongly varying transition timescales.
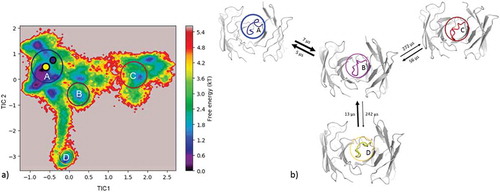
Figure 6. Hierarchical clustering analysis of 11 µs of trajectories (1100 frames) of the Hemagglutinin Fv 17/9 CDR-H3 loop obtained by aligning on the whole Fv and using a distance criterion of 4 Å. Three black vertical lines in the dendrogram show which cluster the crystal structures belong to (1HIL AGless, 1HIM and 1HIN AGed). The dendrogram for the CDR-H3 loop is illustrated with the corresponding plot on the right showing the cluster populations and the number of transitions observed in the simulations. Below the structural ensemble of the CDR-H3 loop is displayed color coded according to the dendrogram.
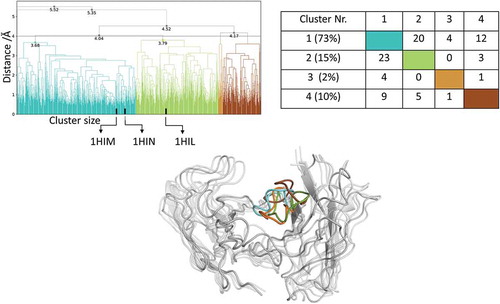
Figure 7. (a) Estimated free energy surface of the CDR-H3 loop based on a tICA including the projected crystal structures. The AGed X-ray structures are colored orange and red, while the AGless X-ray structure is colored in blue. The macrostates are illustrated as circles and were identified with PCCA+ clustering. (b) First mean passage times combined with the representative macrostate structures based on tICA of the CDR-H3 loop. The thickness of the circles represents state probabilities, while the width of the arrows relates to the strongly varying transition timescales.
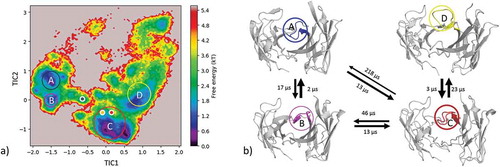
Figure 13. Crystal contacts of the AGless antibody Fab (1HIL) with the tail of a symmetry mate (salmon), which causes a rearrangement of the CDR-H3 loop (blue). The bound X-ray structure (1HIM) is shown in yellow. The residues showing interactions with the CDR-H3 loop are colored red.
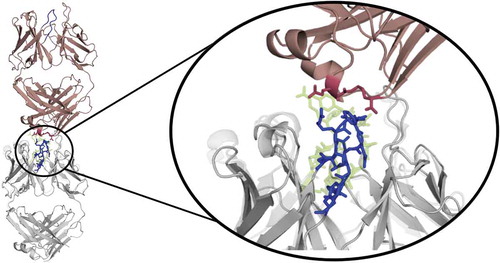
Figure 8. Hierarchical clustering analysis of the 10 µs of trajectories (1000) of the Ferrochelatase Fv CDR-H3 loop obtained by aligning on the whole Fv and using a distance criterion of 3.6 Å. Two black vertical lines in the dendrogram show which cluster the crystal structures belong to (1NGZ AGless, 1N7M AGed). The dendrogram for the CDR-H3 loop is illustrated with the corresponding plot on the right showing the cluster populations and the number of transitions observed in the simulations. Below the structural ensemble of the CDR-H3 loop is displayed color coded according to the dendrogram.
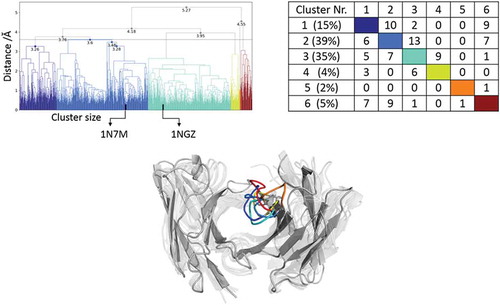
Figure 9. (a) Estimated free energy surface of the CDR-H3 loop based on tICA including the projected crystal structures. The AGed X-ray structure is colored green, while the AGless X-ray structure is colored in blue. The macrostates are illustrated as circles and were identified with PCCA+ clustering. (b) First mean passage times combined with the representative macrostate structures based on tICA of the CDR-H3 loop. The thickness of the circles represents state probabilities, while the width of the arrows relates to the strongly varying transition timescales.
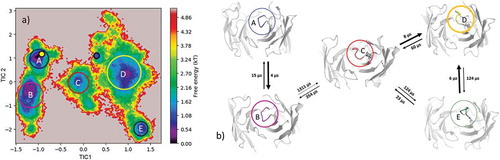
Figure 10. Hierarchical clustering analysis of 16 µs of trajectories of the Idarucizumab (1600 frames) Fv CDR-H3 loop obtained by aligning on the whole Fv and using a distance criterion of 4 Å. Two black vertical lines in the dendrogram show which cluster the crystal structures belong to (4YHI AGless, 4YGV AGed). The dendrogram for the CDR-H3 loop is illustrated with the corresponding plot on the right showing the cluster populations and the number of transitions observed in the simulations. Below the structural ensemble of the CDR-H3 loop is displayed color coded according to the dendrogram.
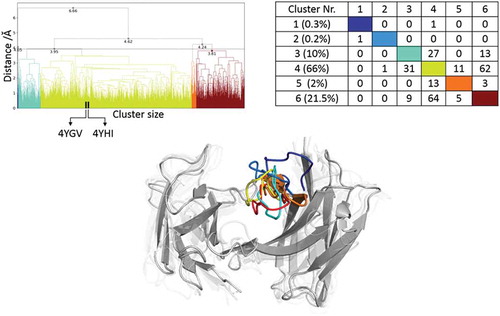
Figure 11. (a) Estimated free energy surface of the 16 µs of trajectories of the CDR-H3 loop based on tICA including the projected crystal structures. The AGed X-ray structure is colored yellow while the AGless X-ray structure is colored in blue. The macrostates are illustrated as circles and were identified with PCCA+ clustering. b) First mean passage times combined with the representative macrostate structures based on tICA of the CDR-H3 loop. The thickness of the circles represents state probabilities, while the width of the arrows relates to the strongly varying transition timescales.