Figures & data
Figure 1. Frequency and distribution of SIRPα variants across human populations. The distribution and frequency of SIRPα alleles in the five super populations (a) and their respective subpopulations (b). In the 1000 Genome Project, the population from different locations around the globe are divided into five super populations as African (AFR), Ad Mixed American (AMR), East Asian (EAS), European (EUR) and South Asian (SAS). These super populations are further divided into total of 26 subpopulations. The code for the subpopulation can be found at http://www.internationalgenome.org/category/population/.
Table 1. Sequence identities of SIRPα IgV domains. The percentage amino acid sequence identities of IgV domains of SIRPα from human v1 (NP_542970.1), human v2 (CAA71403.1), cynomolgus monkey (EHH65484.1), 129 mouse (162330193) and chicken (NP_001032920.2) sources are listed, respectively. Percentage identity is calculated based on identical residues among all ungapped positions between sequence pairs. % Identity
Figure 2. Isolation of anti-SIRP⍺ antibodies from wild-type and transgenic chickens. (a) Schematic depicting the generation of pan-allele and pan-mammalian anti-SIRP⍺ antibodies. (b) Plasma titers to hSIRP⍺ v1, hSIRP⍺ v2, mSIRP⍺ NOD, and mSIRP⍺ m129 in wild-type (left), SynVH (middle), and OmniChicken (right) chickens.
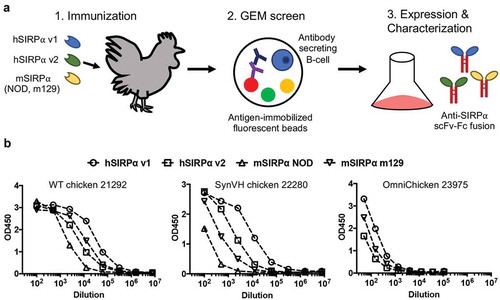
Table 2. Summary of the chicken immunization scheme and GEM screen results. Eight chickens (two wildtype, two SynVH and four OmniChickens) were immunized as described below. To drive response toward a cross-reactive repertoire, all the chickens were immunized by SIRPα allele v1 followed by boosts that alternate between human SIRPα allele (v1 vs v2) and/or species (mouse NOD or 129 vs. human SIRPα). Various GEM screen combinations were used to facilitate the discovery of anti-SIRPα antibodies with unique binding profiles. A total of 200 chicken antibodies were cloned and the variable domain region sequenced.
Figure 3. Surface plasmon resonance binding profiles of representative anti-SIRPα blocker, non-blocker, and kick-off antibodies. To assess if the anti-SIRPα antibodies can block CD47 binding to SIRPα in vitro, the antibodies were first captured by anti-human IgG-Fc on GLC chip as described in Materials and Methods. Next, 100 nM of a high-affinity SIRPα variant (CV1) pre-mixed with CD47 at concentrations of 0, 20, 55, 500, or 1500 nM were injected over the antibody-immobilized chip. The representative SPR sensorgrams for (a) blocking antibody clone 119, (b) non-blocking antibody clone 123, and (c) kick-off antibody clone 118 are shown. All sensorgrams were baseline-adjusted and reference cell-subtracted.
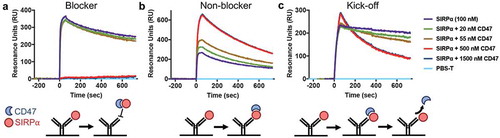
Figure 4. anti-SIRPα antibodies bind six unique epitopes on SIRPα. (a) Sorted heat map depicting the binning assignments for a representative subset of discovered anti-SIRPα antibodies. Anti-SIRPα antibodies bound to the chip are in rows and the anti-SIRPα antibodies injected over the chip in columns. Red boxes indicate that the antibodies compete with each other (and considered to bind the same epitope). Green boxes indicate that the antibodies form a sandwich (and considered to bind to different epitopes). Yellow boxes indicate scenarios where the data from one orientation disagrees with the other. (b) Phylogenetic tree for the subset of anti-SIRPα antibodies shown in (a). (c) Node plot illustrating the connectivity and blocking relationships between the anti-SIRPα antibodies in the six epitope bins. Antibodies isolated from wild-type, SynVH and OmniChickens are indicated as a triangle, circle, and square, respectively. Antibodies that bind to human, cynomolgus, and mouse SIRP (as well as SIRPβ and SIRPγ) are colored blue; those that bind to human SIRPα v1, v2, and cynomolgus SIRPα are colored yellow; and the remaining antibodies with varied specificities are colored white. Antibodies in Bin 1 do not cross-block antibodies in other bins. However, antibodies in bins 2, 3, 4, 5, 6 harbor cross-blocking properties indicated by the connecting grey lines.
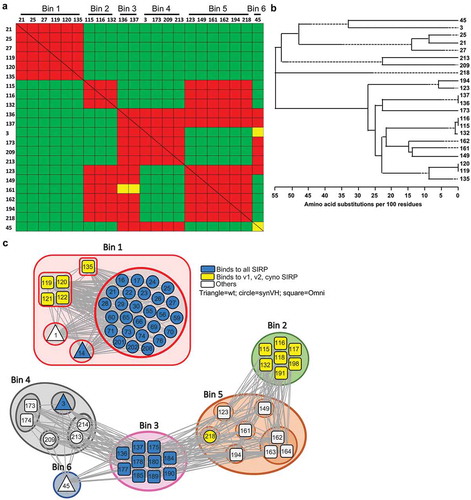
Figure 5. Crystal structures of anti-SIRPα antibodies bound to the IgV-domain of hSIRPα v1. (a) Structure of the SIRPα (pink)-CD47 (teal) complex superimposed with the anti-SIRPα blocking antibody Fab clone 119 (blue), non-blocking antibody Fabs clones 3 (pale pink), 136 (grey), and 218 (purple), and kick-off antibody Fab 115 (light green). (b) Overlay of the CD47/SIRPα complex and the blocking antibody clone 119 complex with a detailed view of CDR-H3 insertion into SIRPα pocket shown on the right. (c) Depiction of SIRPα (pink) epitopes bound by CD47 (teal) and anti-SIRPα antibody clones 119 (blue), 3 (pale pink), 136 (grey), 218 (purple), and 115 (light green). Residues shared between the blocking (119) and kick-off (115) antibodies and CD47 are colored yellow. Venn diagrams adjacent to each surface map indicate the relative extent of overlap between the blocking Fab 119 anti-SIRPα antibody, SIRPα, and CD47. For non-blocking antibodies, the yellow and white in the Venn diagrams indicate the overlap of epitopes between Fab 3, 136, and 218. (d) Overlay of the kick-off antibody clone Fab 115 (light green) and CD47 (teal) in complex with SIRPα (pink). The inset to the right shows the position of the C’D loop of SIRPα in the CD47-bound (pink) complex or the Fab 115-bound (orange) complex. The Glu 54 residues is modeled in the C’D loop to highlight the varying position depending on whether the binding partner is CD47 or Fab 115.
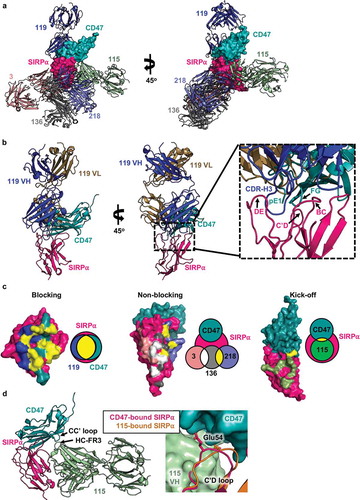
Table 3. Binding affinities KD (M) of representative anti-SIRPα antibodies. Representative clones from each epitope bin were selected and their binding affinities to various SIRP (human SIRPα v1, v2; cynomolgus SIRPα; mouse NOD, BL6, BALB/c SIRPα; human SIRPγ; human SIRPβ1) were determined by SPR. A Langmuir kinetic model was used for fitting and calculation of KD (M). The ability of the antibody to block CD47 binding to SIRPα is indicated in the last column.
Figure 6. Anti-SIRPα blocking antibody clone 119 binds with high affinity to human and cynomolgus SIRPα and potently blocks CD47 binding to cell surface SIRPα. (A-C) SPR analysis of the binding kinetics of anti-SIRPα antibody clone 119 binding to (a) hSIRPα v1, (b) hSIRPα v2, and (c) cynomolgus SIRPα. (d) Competition assay depicting dose-dependent antagonism of CD47-Fc binding to human CD14+ monocytes by anti-SIRPα blocking antibody clones 119 and 135.
Figure 7. Anti-SIRPα antibodies potentiate macrophage-mediated ADCP in vitro. (a) Phagocytosis of DLD-1 cells by human monocyte-derived macrophages treated with the tumor-specific, anti-EGFR antibody cetuximab alone (closed square) or in combination with anti-SIRPα blocking (clone 119) or non-blocking (clone 136) antibodies. (b) Bar graph depicting the EC50 of phagocytosis (as shown in a) of anti-SIRPα antibodies from various epitope bins. Bin 1 = blocking, bin 2 = kick-off, and bins 3–6 = non-blocking. Phagocytosis was conducted using DLD-1 cells as targets with cetuximab in combination with anti-SIRPα antibodies (black bars), or OE19 target cells with trastuzumab in combination with anti-SIRPα antibodies (grey bars). (c) Dose-dependent enhancement of DLD-1 phagocytosis by human monocyte-derived macrophages treated with cetuximab in combination with anti-SIRPα intact IgG antibodies (blocking clone 21 and non-blocking clone 136) or the corresponding F(ab’)2 fragments. (d) Macrophage phagocytosis of DLD-1 cells treated with cetuximab alone or in combination with the hSIRPα v1 allele-specific antibodyCitation39 or pan-allele reactive anti-SIRPα v1/v2 antibody clone 21 as a function of macrophage SIRPα genotype. Data are normalized to the maximum phagocytosis observed in the clone 21 group. Data in panels A, C, and D are the mean (n = 3), and error bars indicate SD. Dashed lines represent data fit to a log-agonist vs. response model in Prism.