Figures & data
Figure 1. Stepping-energy CID spectra of pronase-treated N-glycopeptides (covering glycosylation site Asn163) of atacicept with the peptide sequence 163NST165. Compounds with the same mass and retention time of two different production batches were compared featuring the same fragmentation pattern and thus, could be identified as the same structure. (a + b) Spectra of the glycopeptide carrying a diantennary core-fucosylated structure. (c + d) Spectra of the glycopeptide carrying a diantennary and disialylated core-fucosylated structure.
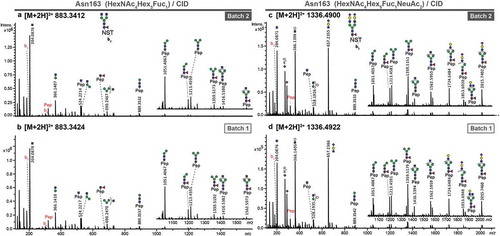
Table 1. N-glycan compositions and proposed structures with retention times (RT) identified on N-glycosylation site Asn163 of atacicept. Samples were treated with pronase and glycopeptides were analyzed by C18-PGC-LC-ESI-MS/MS. Hex = white circle = hexose, HexNAc = N-acetylhexosamine, Fuc = red triangle = fucoses, NeuAc = purple diamond = N-acetylneuraminic acid, yellow circle = galactose, blue square = N-acetylglucosamine, green circle = mannose.
Figure 2. Relative quantitation of N-glycoforms of atacicept. (a) Released N-glycans were analyzed by MALDI-TOF-MS after linkage-specific sialic acid derivatization. Peak intensities were normalized based on the total intensities of all N-glycans in a sample. Sialic acids (purple diamond) pointing to the right indicate α2,3-linkage. (b) Tryptic N-glycopeptides were analyzed by C18-RP-LC-MS, and peak intensities were normalized on the total peak intensity of all N-glycopeptides in a sample. Standard deviations are shown.
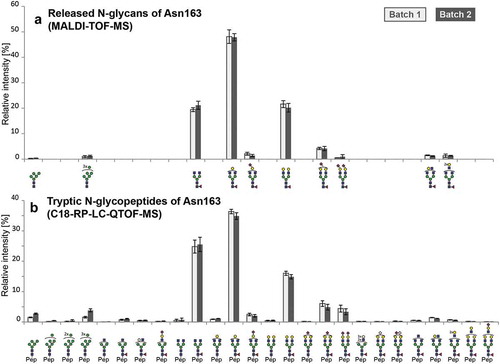
Figure 3. MS/MS spectra of pronase-treated O-glycopeptides of atacicept. (a) Stepping-energy CID spectra of the O-glycopeptide 86SDKT89 covering glycosylation site Ser86 with a monosialylated core 1-type glycan. (b) Stepping-energy CID spectra of the O-glycopeptide 91TCPPCPAPE99 covering the glycosylation site Thr91 with a monosialylated core 1-type glycan. (c + d) ETD spectra of the O-glycopeptide 86SDKT89 covering glycosylation site Ser86 carrying a monosialylated core 1-type glycan from two different production batches. Compounds with the same mass and retention time from two different production batches were compared featuring the same fragmentation pattern and thus, could be identified as the same glycopeptides.
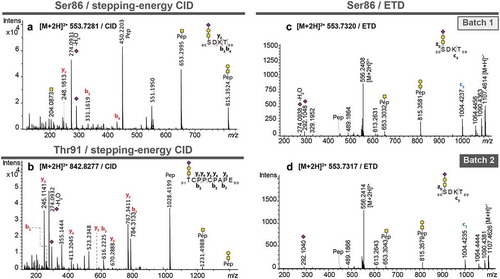
Figure 4. O-glycosylation analysis of the de-N-glycosylated intact protein using CESI-MS. (a) Deconvoluted spectra of the monomeric reduced de-N-glycosylated protein species. (b) Deconvoluted spectra of the dimeric de-N-glycosylated protein species. (c) Relative quantitation of the unglycosylated and O-glycosylated monomeric and (d) dimeric protein based on triplicate analysis. Standard deviations are shown.
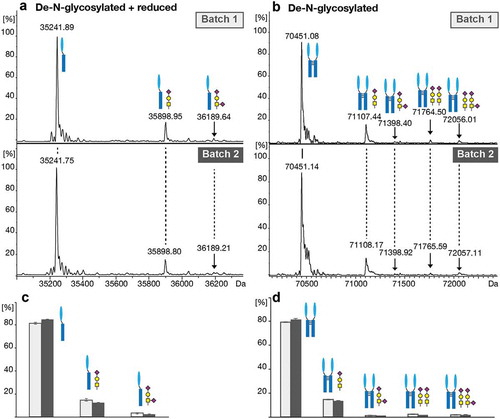
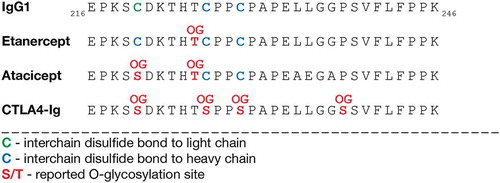
Figure 5. Hinge region O-glycosylation of IgG1 Fc-fusion proteins. A part of the hinge region and CH2-domain sequences of IgG1 and the Fc-fusion proteins etanercept, atacicept and CTLA4-Ig are shown. Disulfide bonds and reported O-glycosylation sites for etanercept,Citation28,Citation29 CTLA4-IgCitation30 and atacicept are highlighted. Amino acid numbering by Edelman et al.Citation31 OG, O-glycan.