Figures & data
Figure 1. Definition of relative binding free energy function for optimization of pH dependence. The main property to be optimized is ∆∆∆Gbinding, the binding free energy gap between the Acidic and Physiological pH environments of a Mutant relative to the Parent, which has to be as negative as possible. This is shown in the upper diagram as the difference given by (1) – (2). Computationally, we simulate (3) – (4) instead, which from the thermodynamic cycle yields the same quantity. The bottom diagram provides an illustrative example for a possible distribution of free energies for the four states shown in the thermodynamic cycle, and how ∆∆∆Gbinding can be calculated based on their free energies
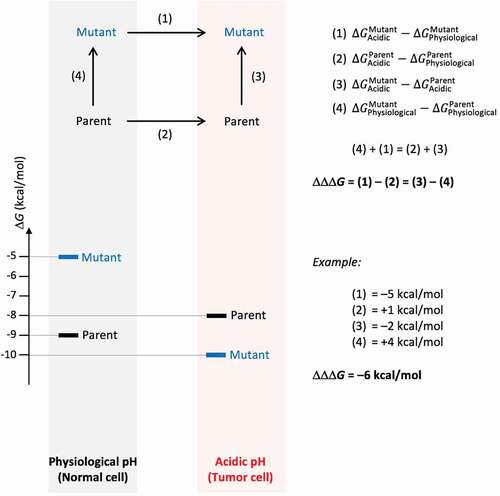
Table 1. Computational predictions of relative binding affinities and stabilities under slightly acidic and physiological pH conditions
Figure 2. Structural location of selected histidine mutations. Shown is the crystal structure of the parental bH1-Her2 complex (PDB code 3BE1)Citation40 as prepared for molecular simulations. Only the antigen-binding Fv domains of the antibody are shown, and colored cyan and magenta for the heavy and light chains, respectively. Selected positions for mutation to histidine are shown as Cα-sphere models and are labeled. Domain IV (residues C489-N607) of the Her2 antigen including the epitope is rendered as a black ribbon inside a translucent gray molecular surface
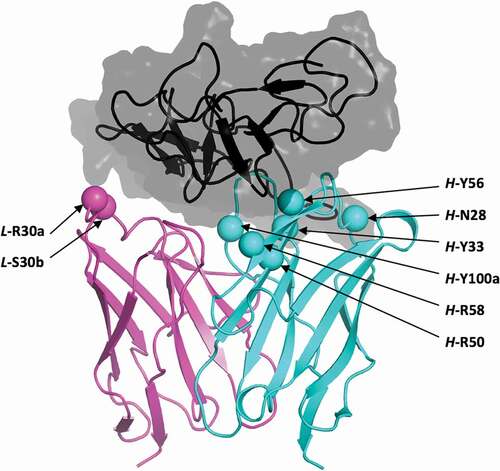
Table 2. SPR data for Fab binding to recombinant human Her2 ectodomain
Figure 3. Iso-affinity plots from SPR data. Acidic pH data are plotted with red symbols, physiological pH data with black symbols. Arrows indicate moving the data point on the iso-affinity plot from physiological to acidic environments for various variants (labeled, mean data from )
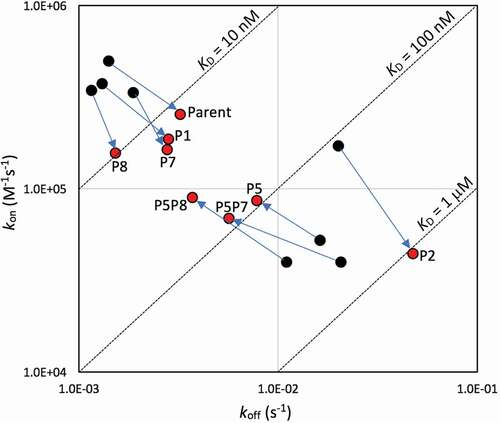
Figure 4. Representative SPR sensorgrams for select Fab variants. Interaction of the parent bH1-Fab, the lead single mutant bH1-P5 (H-R58H) and the double mutant bH1-P5P8 (H-R58H,L-S30bH) with immobilized Her2 ectodomain. The black lines represent raw data and the red lines are global fits to a 1:1 bimolecular interaction model. See the Materials and Methods section for experimental details
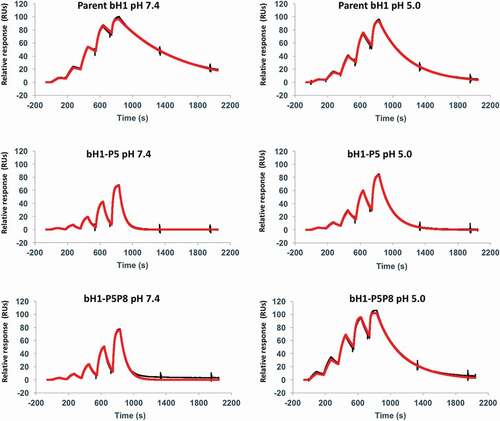
Table 3. Apparent binding affinities to SKOV3 cells for bH1 variants formatted as Fabs
Figure 5. pH dependence of Fab variants binding to Her2-expressing SKOV3 cells. Selected anti-Her2 Fab variants were analyzed for cell-based binding by flow cytometry under acidic and physiological pH conditions (using Method A, Materials and Methods section). Error bars represent standard deviations between technical replicates
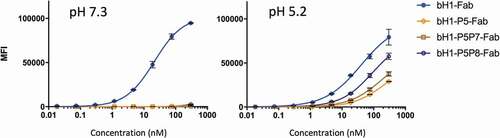
Table 4. Apparent binding affinities to SKOV3 cells for bH1 variants formatted as full-size antibodies (FSAs)
Figure 6. pH dependence of FSA variants binding to cells expressing Her2. (A) High-density Her2 cells (SKOV3) were tested in environments with varying pH between 5.2 and 7.3 and cell binding was analyzed by flow cytometry (using Method A, Materials and Methods section). Error bars represent standard deviations between technical replicates. (B) Apparent dissociation constants (KD) of tested FSA variants from binding experiments to high-density Her2 cells (SKOV3) at various pHs
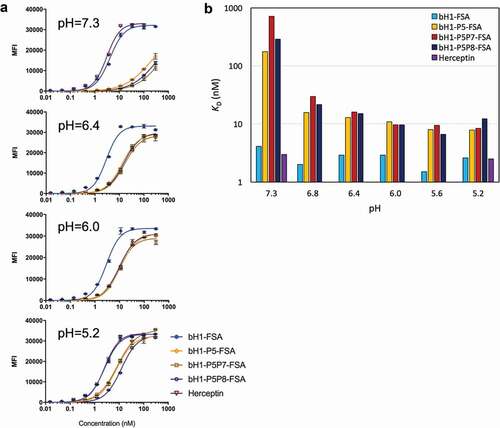
Figure 7. pH dependence of FSA variants binding to cells expressing Her2 at low-density. Low-density Her2 expressing JIMT-1 cells were tested under acidic and physiological pH conditions and cell binding was analyzed by flow cytometry (using Method A, Materials and Methods section). The left panel representing binding to the normal cell model (low-density Her2 and physiological pH) is to be compared with binding of the same variants to the tumor cell model consisting of high-density Her2 (SKOV3 cells) within a pH range of 6.0–6.8 (). Error bars represent standard deviations between technical replicates
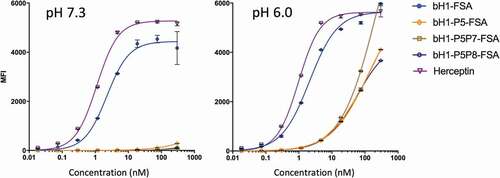
Figure 8. Tumor spheroid growth inhibition. Human breast primary carcinoma BT474 spheroids were cultured in physiological pH and in acidic pH of 6.4 in the presence of antibodies Herceptin, bH1-FSA, bH1-P5P8-FSA or Ctrl-hIgG (human IgG1 isotype antibody, negative control), and spheroid size monitored over time (see Materials and Methods section). (A) Dose-response effect of antibody variants in different pH conditions at the 192 h time point. Spheroid size is normalized to time zero and Ctrl-hIgG. (B) Spheroid growth over time for different antibody variants in different pH conditions. Spheroid size is normalized to time zero and Ctrl-hIgG. The p-values for each treatment relative to the control were calculated using Student’s t-test (*, p ≤ 0.05; **, p ≤ 0.01). (C) Representative images of the spheroids at 100 μg/mL antibody concentration in different pH conditions at the end of experiment. Error bars in (A) and (B) represent standard deviations between biological replicates
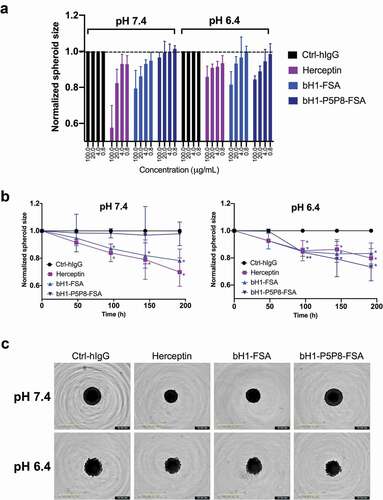
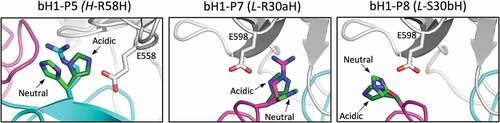
Figure 9. Structural details of pH-sensitive histidine mutations. Antibody chains of the parental bH1 antibody are colored as in , and the antigen is rendered as gray tube. At each mutated position, the parental side chain and its histidine side chain substitutions in the acidic conditions (dark-green C atoms) and physiological conditions (bright-green C atoms) are overlaid and rendered as sticks model. The main interacting side chains of the antigen are shown in sticks models and labeled. Rosetta models for histidine mutants shown