Figures & data
Figure 1. Routes of administration for therapeutic antibodies
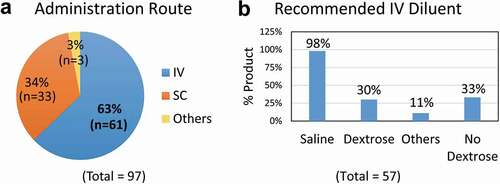
Table 1. Diluents approved for intravenous infusion of therapeutic antibodies
Table 2. Therapeutic antibodies tested for compatibility with dextrose and human serum in vitro
Figure 2. Aggregation of therapeutic mAbs after mixing with dextrose and human serum in vitro
Figure 3. pH-dependence of protein aggregation of therapeutic mAbs in mixtures with dextrose and human serum
Figure 4. Ionic strength-dependence of aggregation of therapeutic mAbs in mixtures with dextrose and human serum
Table 3. Comparison of protein aggregates in the mAb-dextrose mixtures with human serum and plasma
Figure 5. Comparison of protein aggregates in the mAb-dextrose mixtures with serum and plasma
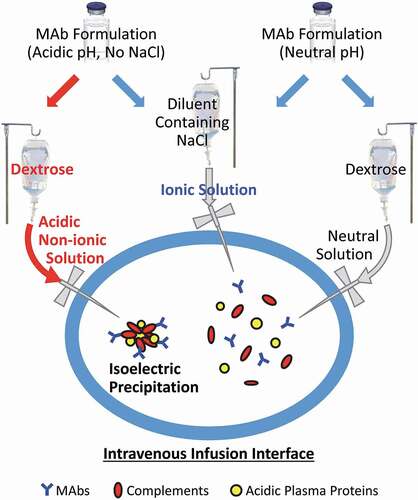
Figure 6. Potential biochemical pathways driving protein aggregation at the IV infusion interface