Figures & data
Figure 1. Analysis of residues involved in aggregation in CH2 for optimization. (a). Prediction of APRs in CH2 and m01s by the online program TANGO. Three major APRs (APR1-3, highlighted by purple, green and red, respectively) that located at three different β-strands in two different sides are identified. (b). The analysis of the crystal structure of CH2 domain (PDB entry: 3DJ9). The exposed residues F241 and F243 in strand A (blue), T260, V262, V264 in APR1 (purple), N276, Y278 in APR2 (green) and R301, V303, V305 in APR3 (red) are shown. (c). The conceptual sketch of the CH2 optimization approach. Six residues in APR1 (T260, V262, and V264) and APR3 (R301, V303 and V305) and two exposed “phenylalanine” on strand A (F241 and F243) in one side were randomly mutated for library construction. Those resides in APR2 (from F275 to V279) on the other side were scanned by site mutagenesis of lysine
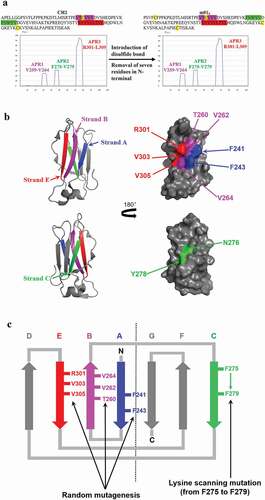
Figure 2. Selection of clone m01s5.4. (a). Prediction of APRs in m01s5. Only one major APR (APR2 in m01s in ) could be identified after panning. (b). Prediction of APRs in m01s5.4. No obvious cluster is identified. (c). Sequence alignment of m01s, m01s5 and m01s5.4. (d). Soluble expression of m01s and m01s5.4. Left: SDS-PAGE, right: Western blot. m01s5.4 shows good soluble expression as m01s at 37°C
Figure 3. Characterization of m01s5.4. (a). Oligomer formation of m01s5.4 and m01s measured by SEC. m01s5.4 exists as a monomer. (b). CD for secondary structure measurement. Typical maximum negative peak appears at 216 nm indicating a β-sheet structure. (c). Binding of m01s5.4 and m01s to mouse anti-human CH2 monoclonal antibody. HSA was used as a negative control. (d). Binding of m01s5.4 and m01s to anti-human CH2 Fab (m01m1). HSA was also used as a negative control. In general, m01s and m01s5.4 show similar binding to these two tested antibodies
Figure 4. The stability of m01s and m01s5.4. (a). Thermo-induced unfolding curve measured by CD. The CD signal was recorded at 216 nm in the temperature range from 25–94°C with a heating rate of 0.5°C/min. Tm of m01s (82.0 ± 0.1°C) is higher than that of m01s5.4 (68.5 ± 0.3°C). (b). Urea-induced unfolding of m01s and m01s5.4. m01s (8.4 ± 0.1 M) is more stable than m01s5.4 (5.6 ± 0.2 M) in urea-induced unfolding
Figure 5. Comparison of aggregation tendency between m01s and m01s5.4. (a). Turbidity assay of m01s and m01s5.4 after 60°C incubation at different time points. OD320 of m01s increases obviously while that of m01s5.4 only changes slightly. (b). Evaluation of soluble aggregation formation by SEC. Besides Peak 1, there is an obvious aggregation peak (Peak 2) in the case of m01s at the end of 60°C incubation. In contrast, only one peak (Peak 1) is observed in the case of m01s5.4
Figure 6. Measurement of aggregation formation in m01s and m01s5.4 after incubation at 60°C and 37°C by DLS. In general, the peak in the case of m01s becomes larger after incubation, indicating the formation of large soluble oligomers, while the peak in the case of m01s5.4 does not obviously change
Figure 7. Binding of m01s5.4 and m01s to HSA and a panel of viral or cancer-related antigens. m01s displays relatively strong nonspecific binding to all tested proteins especially at the high concentration, while m01s5.4 has no obvious binding to these antigens at the same concentration, indicating the low nonspecific binding capacity of m01s5.4
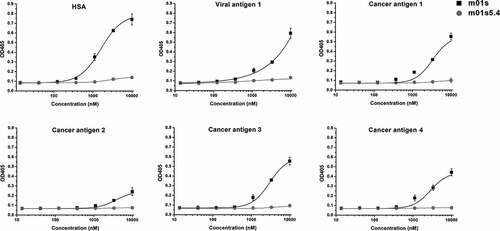
Figure 8. Application of m01s5.4 in a specific m01s-based binder (D3-m01s) against a tumor-associated antigen (TAA). (a). Oligomer formation of the parental clone D3-m01s and its mutant D3-m01s5.4 measured by SEC. D3-m01s5.4 exists as a monomer, while the mixture is observed in D3-m01s. (b). Comparison of binding of D3-m01s and D3-m01s5.4 to TAA measured by ELISA. The EC50 of binding of D3-m01s and D3-m01s5.4 to TAA is about 63 and 45 nM, respectively, indicating the promising application value of m01s5.4